Figure 2.
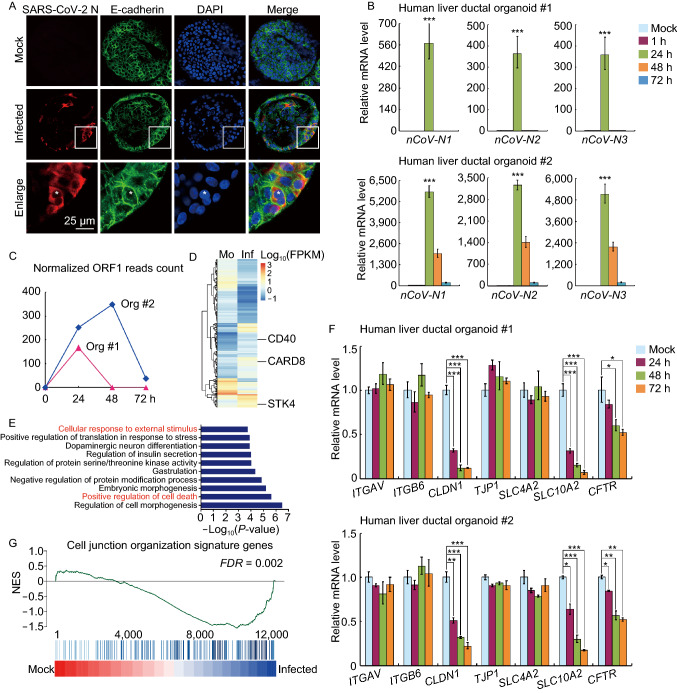
Recapitulation of SARS-CoV-2 infection in human liver ductal organoids. (A) Immunofluorescence staining for SARS-CoV-2 N protein and E-cadherin in human liver ductal organoids. (B) Two cases of human liver ductal organoids were harvested at indicated time points following SARS-CoV-2 infection to examine the virus load using qRT-PCR. RNP was used as an internal control. (C) Changes in expression of ORF1 in human liver ductal organoids (Org #1 and Org #2) in response to SARS-CoV-2 infection at indicated times. (D) Heatmap showing differentially expressed genes (DEGs) in SARS-CoV-2-infected organoids (Inf) (24 h) versus the mock (Mo). (E) GO analysis of DEGs. Top 10 enriched biological processes were shown. (F) Two cases of human liver ductal organoids after SARS-CoV-2 infection were harvested to examine the expression of indicated genes using qRT-PCR. GAPDH was used as an internal control. Data were presented as mean ± s.d. * indicates P < 0.05; ** indicates P < 0.01; *** indicates P < 0.001 (G) GSEA enrichment analysis of SARS-CoV-2-infected organoids (48 h) versus the mock for cell junction organization signature genes

