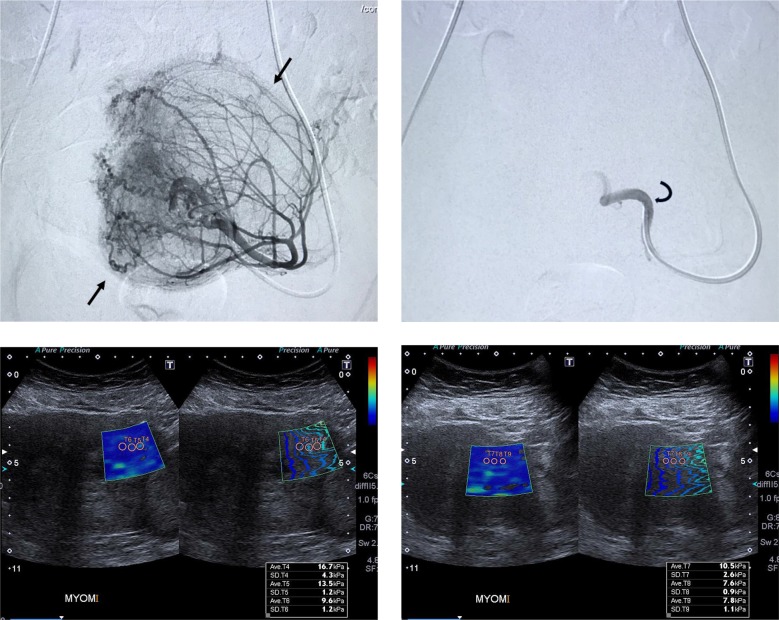
Figure 1.
Uterine arteriogram obtained from 43-year-old woman with an uterine leiomyoma. Arrows outline the blood vessel supply of the leiomyoma. b. View of the same uterine artery after uterine leiomyoma embolization. No distal flow is noted. (Curved arrow points to catheter tip.) Ultrasound and shearwave elastography (SWE) images of the leiomyoma. c. before and d. 1.5 months after embolization. There is a significant decrease in the SWE measurements of the leiomyoma after treatment. The vertical bar on the right shows the elasticity range, the change in colors inside the box from dark blue to red indicates increasing stiffness.

