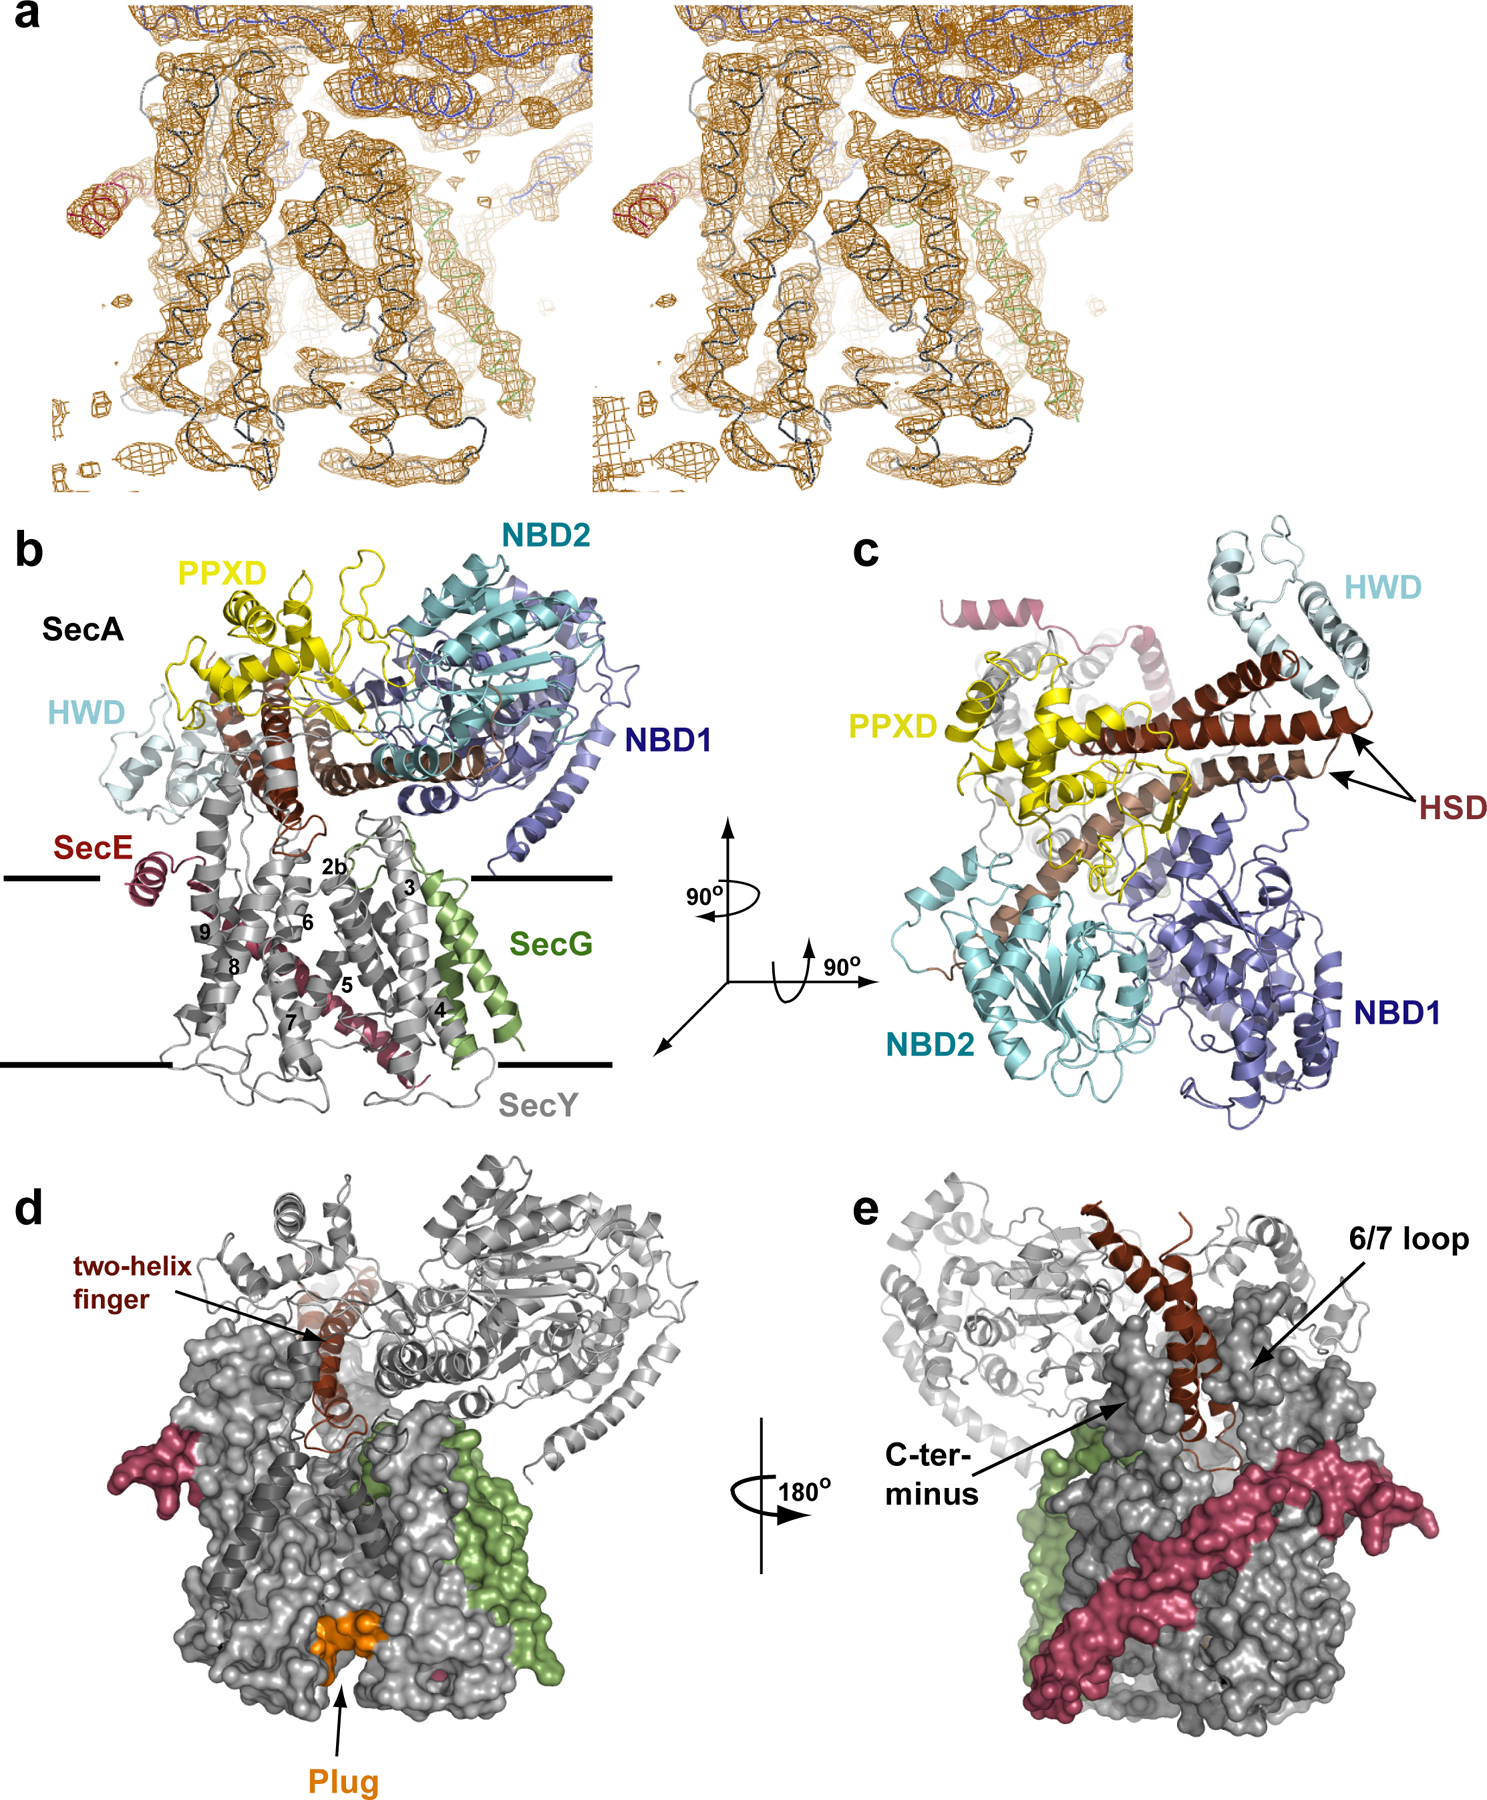
Figure 1.

Architecture of the T. maritima SecA–SecYEG complex. a, Stereo view of a σA-weighted, phase combined, NCS averaged, and B-factor sharpened 2Fo - Fc electron density map (contoured at 1σ). The view of the lateral gate of SecY is shown, with the Cα-trace of SecY in grey, SecE in red, SecG in green and SecA in blue. b, Cartoon of the complex viewed from the side. The lines indicate the membrane boundaries. c, As in b, but viewed from the cytoplasm. d, The two-helix finger of SecA inside the cytoplasmic funnel of SecY. TM2b and TM8, as well as the tip of the 6–7 loop, are shown as cartoons for clarity. Plug residues are coloured in orange. e, As in d, but shown from the back.
