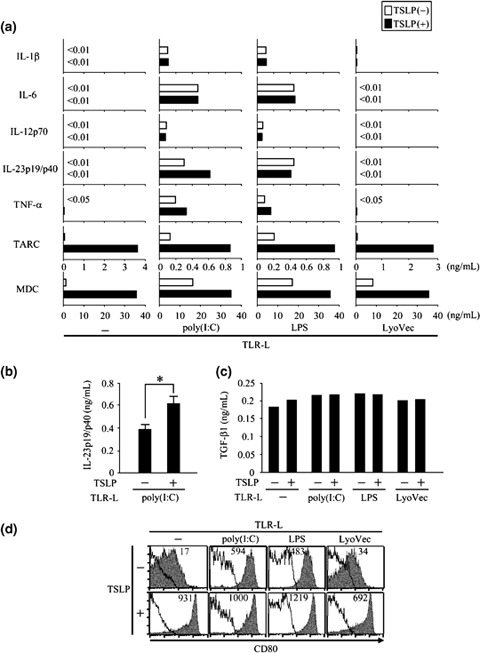
Figure 2.

TSLP conserved its unique abilities in DC activation in the presence of TRLs and enhanced TLR3 ligand induced IL‐23 production. Blood CD11c+ DCs were activated by TLR‐ligands, poly(I : C), LPS, or LyoVec, with or without TSLP for 24 h. (a), IL‐1β, IL‐6, IL‐12p70, IL‐23p19/p40, TNF‐α TARC, and MDC were measured in the culture supernatant by protein ELISA. (b), IL‐23p19/p40 production measured by protein ELISA. Closed bar and horizontal error bars indicate the mean and SD of five independent experiments, respectively. Student's t‐test for unpaired data was used to compare the values between two groups. * P<0.05. (c), TGF‐β1 concentration measured by protein ELISA. (d), Cell‐surface marker phenotypes of DCs were determined by flow cytometry. Filled histograms represent staining of CD80; open histograms represent the isotype control. Numbers above histograms indicate the mean fluorescence intensity for CD80. Data represent one of five independent experiments. TSLP, thymic stromal lymphopoietin; TLR, Toll‐like receptor; DCs, dendritic cells; MDC, macrophage‐derived chemokine.
