
Figure 1.
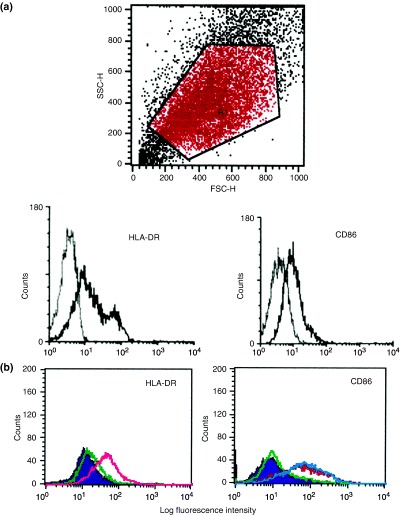
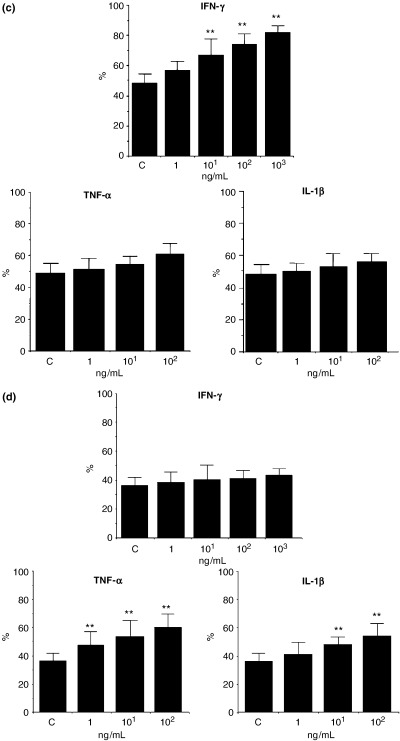
Fig. 3. Effect of IFN‐γ, TNF‐α and IL‐1β on HLA‐DR and CD86 expression in cultured nasal epithelial cells (CNEC). Expression of HLA‐DR and CD86 in CNEC was analysed by flow cytometry as described in the text. Upper panel: forward and side scatter showing gating for epithelial cells. Lower panel: Left: histogram of a representative sample of unstimulated CNEC from a patient with PAR showing the expression of HLA‐DR the (grey line shows the negative control, and the black line shows the HLA‐DR stained one). Right: histogram of a representative sample of unstimulated CNEC from the same patient with PAR showing the expression of CD86 (the grey line shows the negative control, and the black line shows the CD86‐stained one). (b) Left: histogram of a representative sample of CNEC from the same patient with PAR showing the effect of IFN‐γ and TNF‐α on HLA‐DR expression in CNEC. HLA‐DR expression in unstimulated CNEC (filled violet shaded); effect of IFN‐γ on HLA‐DR expression in CNEC (pink line); effect of TNF‐α on HLA‐DR expression in CNEC (green line). A shift to the right in the histogram can be seen after stimulation with IFN‐γ (but not TNF‐α) as compared with unstimulated CNEC. IFN‐γ but not TNF‐α up‐regulated the expression of HLA‐DR. Right: histogram of a representative sample of CNEC from the same patient with PAR showing the effect of IFN‐γ, TNF‐α and IL‐1β on the expression of CD86 in CNEC. CD86 expression in unstimulated CNEC, (filled violet shaded); effect of IFN‐γ on CD86 expression in CNEC, (green line); effect of TNF‐α on CD86 expression in CNEC (blue line) and effect of IL‐1β on CD86 expression in CNEC (red line). A shift to the right in the histogram can be seen after stimulation with IL‐1β and TNF‐α (but not IFN‐γ) as compared with unstimulated CNEC. IL‐1β and TNF‐α but not IFN‐γ up‐regulated the expression of CD86. (c) Effect of IFN‐γ, TNF‐α and IL‐1β on HLA‐DR expression in CNEC. IFN‐γ but not IL‐1β and TNF‐α up‐regulated the expression of HLA‐DR in CNEC in a dose‐dependent manner. Results are expressed as the percentage positive CNEC expressing HLA‐DR. An increase in the percentage positive CNEC expressing HLA‐DR can be seen after treatment with IFN‐γ but not TNF‐α or IL‐1β. (n=6); ** P<0.01. (d) Effect of IFN‐γ, TNF‐α and IL‐1β on CD86 expression in CNEC. TNF‐α and IL‐1β but not IFN‐γ up‐regulated the expression of CD86 in CNEC in a dose‐dependent manner. Results are expressed as the percentage positive CNEC expressing CD86. An increase in the percentage positive CNEC expressing CD86 can be seen after treatment with TNF‐α and IL‐1β but not with IFN‐γ. (n=6); ** P<0.01.