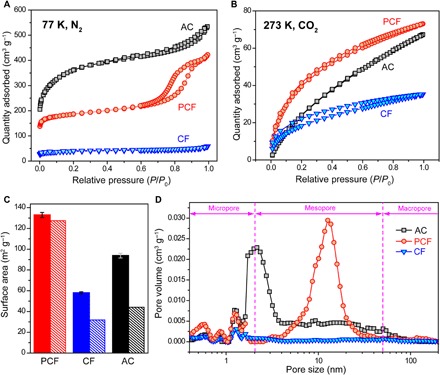
Fig. 3. Characteristics of porous structures.

(A) N2 (at 77 K) and (B) CO2 (at 273 K) physisorption isotherms of PCF, CF, and AC. (C) Surface areas of PCF, CF, and AC. Solid bars represent the BET surface areas determined from the CO2 adsorption isotherms, and dashed bars denote the effective desalination surface areas evaluated from the desalination capacity and the radius of hydrated Na+ (see Supplementary Methods). The error bars are instrument errors. (D) PSDs of PCF, CF, and AC determined by nonlinear density functional theory. The dashed vertical line marks the boundary between different pores (i.e., micropores, mesopores, and macropores). The PSDs of the micropores and mesopores are derived from CO2- and N2-physisorption isotherms, respectively.
