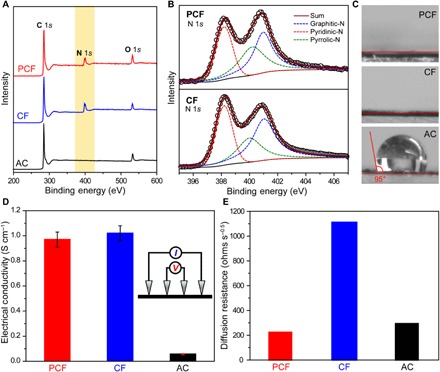
Fig. 4. Chemical and electrical properties.

(A) XPS survey spectra of PCF, CF, and AC. The light-yellow region highlights the N 1s peak. (B) The N 1s spectra of PCF and CF. The black circles are experimental data. The red, green, and blue dashed peaks represent pyridinic-N, pyrrolic-N, and graphitic-N, respectively. The solid burgundy curves are the best fittings. (C) Static contact angles of NaCl solution (500 mg liter−1) on the surfaces of PCF, CF, and AC. (D) Electrical conductivities of PCF, CF, and AC measured by a four-point probe. Inset: Scheme of a four-point probe setup. The error bars are standard deviations (SDs) based on at least five independent measurements. Because of the interparticle contact resistance, the electrical conductivity of AC is appreciably lower than those of PCF and CF. (E) Na+ diffusion resistances of PCF, CF, and AC probed by electrochemical impedance spectroscopy (EIS) in NaCl solutions (500 mg liter−1).
