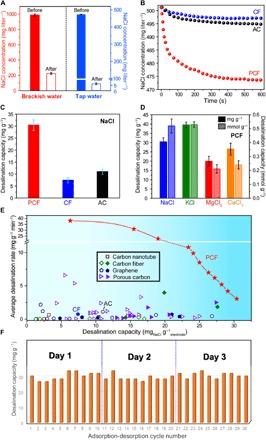
Fig. 5. Desalination performances of PCF, CF, and AC.

(A) NaCl concentrations in brackish water and tap water before and after deionization by PCF. The NaCl concentrations were determined by ion chromatography. (B) Time-resolved NaCl desalination profiles of PCF, CF, and AC in CDI cells with an excess amount of NaCl solution. (C) NaCl desalination mass capacities of PCF, CF, and AC. (D) Gravimetric and molar desalination capacities of PCF for NaCl, KCl, MgCl2, and CaCl2 deionization. (E) CDI Ragone plots of PCF, CF, and AC, in comparison with state-of-the-art carbon electrodes. Solid and open symbols are performances of carbon electrodes with and without N-dopants, respectively. The values are summarized in table S2. The lines are a guide to the eye. (F) NaCl deionization capacity stability of PCF. The error bars represent 1 SD.
