
Fig. 1. Activation of CD4+ T cell hybridomas produced using new BWNur77GFP thymoma.
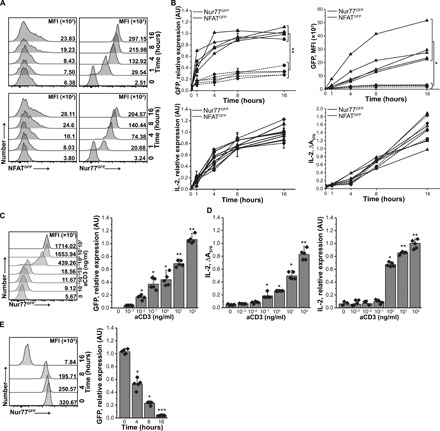
(A) Expression of GFP in NFATGFP (left) and Nur77GFP (right) reporters in response to aCD3 (1 μg/ml) in two representative hybridomas. MFI, mean fluorescence intensity. (B) Up-regulation of NFATGFP or Nur77GFP reporters and IL-2 secretion by aCD3 activated hybridomas. Reporter and IL-2 expression was measured by mRNA (left) and protein level (right). Each symbol marks individual hybridoma (n = 5 of each kind). The experiment was repeated three times, and representative results are shown. The statistic was calculated for t = 16 hours. (C) Expression of Nur77GFP reporter by representative hybridoma activated by titrated aCD3 mAb. Nur77GFP (C) and IL-2 (D) expression by hybridoma from CD4+TCR+Foxp3+ Tregs. GFP and IL-2 expression were measured by FACS/RT-qPCR or by HT-2 assay/RT-qPCR, respectively, from five randomly selected hybridomas. (E) Nur77GFP expression in hybridomas declines gradually following antigen withdrawal. Hybridomas were stimulated with plate-bound aCD3 for 16 hours and then moved to uncoated wells. GFP expression was measured by FACS (left) or RT-qPCR (right) at indicated time points. Means ± SD are shown, and each symbol represents an individual hybridoma. RT-qPCR data were normalized to β-actin. Paired t test; *P < 0.05, **P < 0.01, ***P < 0.001. For statistical analysis, data points in (C) were compared to unstimulated (aCD3 = 0 ng/ml) samples, and for (D), to samples of t = 0 hours.