
Fig. 5. A. muciniphila supports Tregs in vivo expansion.
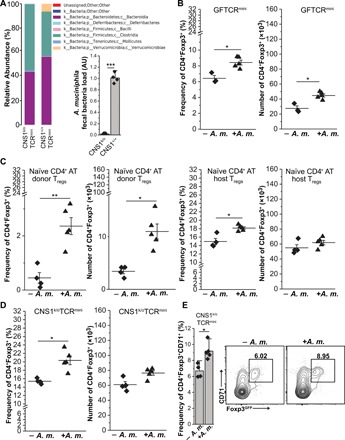
(A) 16S ribosomal RNA analysis of microbiomes from TCRminiCNS1k/o and TCRmini mice. Data were confirmed by RT-qPCR (shown below legend). Reads were first normalized to UniF340/UniR514 and then to CNS1+/+ A. muciniphila signal. (B) Inoculation of GF TCRminiFoxp3GFP mice with A. muciniphila expands colonic Tregs. (C) A. muciniphila induces pTregs and expands tTregs. Naïve CD4+CD44lowFoxp3− cells from congenic TCRmini mice were adoptively transferred into CNS1k/oTCRmini hosts, and half of the recipients received A. muciniphila. Graphs show frequencies (left) and total number (right) of Foxp3+ cells gated according to their origin. (D) TCRminiCNS1k/o mice were colonized with A. muciniphila, and 8 weeks later, their colonic tTregs were analyzed. Graphs show percentage (left) and numbers (right) of CD4+Foxp3+ cells. (E) tTregs up-regulate the CD71 proliferation marker in response to A. muciniphila. Summary and typical dot plots are shown. For (B) to (D), each symbol represents individual animals, and data were obtained in at least two independent experiments. Paired t test; *P < 0.05, **P < 0.01.