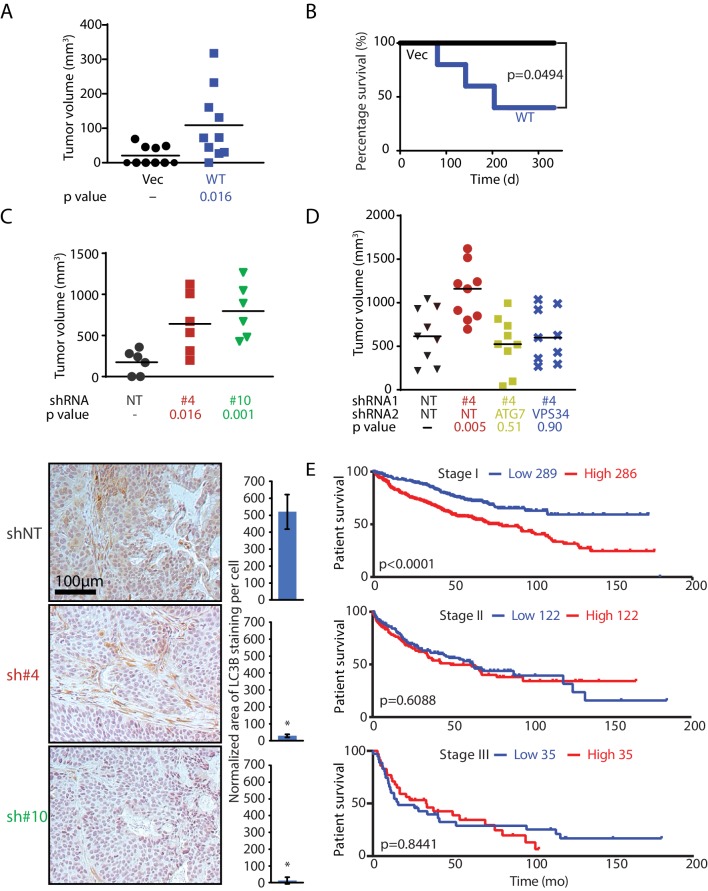
Figure 6. MAGEA6 mutations and expression variation manipulate autophagy to promote tumor progression at different stages.
(A) Tumor volume plot (50 d after injection) and Kaplan-Meier survival plot (B) of xenograft assay using HPDE-iKRAS cells expressing GFP (Vec) or MAGEA6 (five mice, two injections each, N = 10). P value was calculated by two-tailed unpaired t-test in (A) and log-rank test in (B). (C) (Top) Tumor volume plot (100 d after injection) of xenograft assay using BxPC-3 cells transduced with MAGEA6 shRNAs (#4 and #6) and non-targeting shRNA (NT). P value was calculated by two-tailed unpaired t-test (three mice, two injections each, N = 6). (Bottom) Representative photos and quantification of LC3B immunohistochemical staining in the xenograft tumor samples. P value was calculated by two-tailed unpaired t-test (>150 cells analyzed per cohort). (D) Tumor volume plot (100 d after injection) of xenograft assay using BxPC-3 cells transduced with MAGEA6 (#4), ATG7, VPS34 shRNAs and non-targeting shRNA (NT). P value was calculated by two-tailed unpaired t-test (nine mice, one injection each, N = 9). (E) Patient survival analysis of low and high MAGEA6 expression in stage I (top), stage II (middle), and stage III (bottom) lung cancer. Number of patients analyzed per cohort is shown (Győrffy et al., 2013). P value was calculated by log-rank test.


