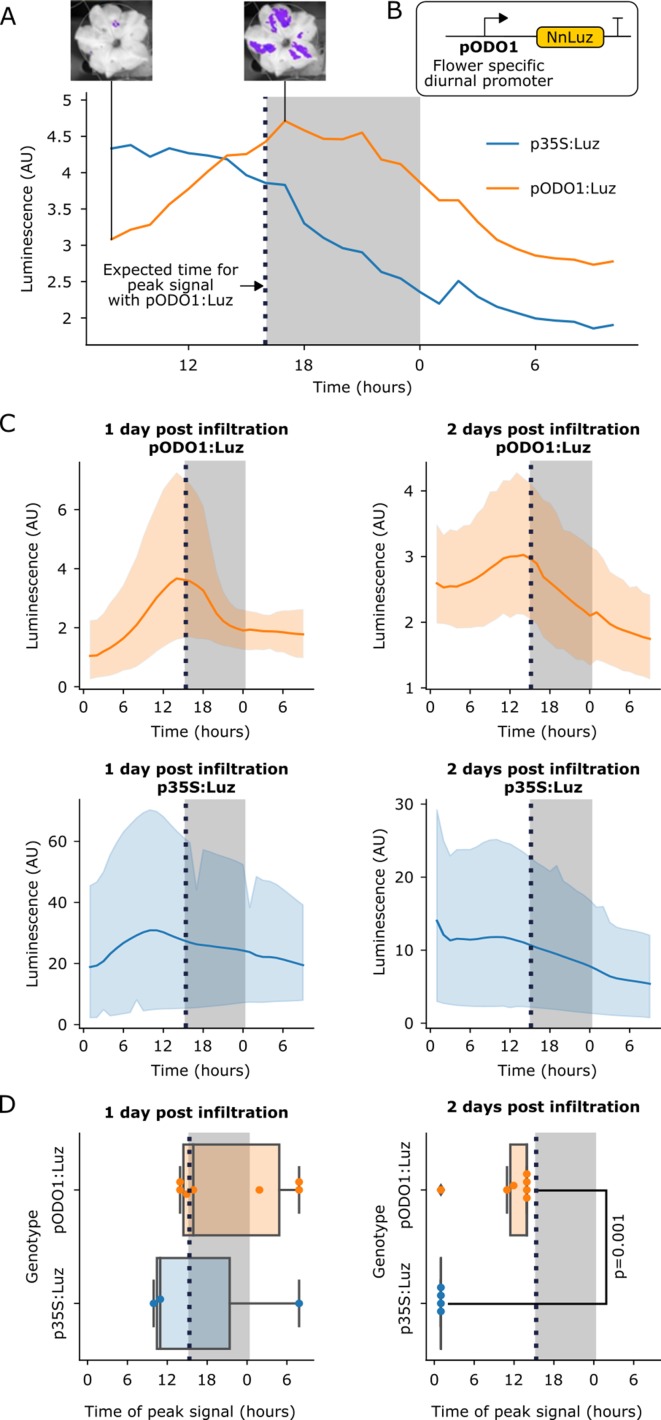
Figure 3. The FBP can be used to build reporters of the spatio-temporal patterns of gene expression.
(A) A representative example of time course luminescence data from long day entrained P. hybrida flowers infiltrated with FBPs. The orange line represents FBP with Luz driven by the ODO1 promoter from Petunia and the blue line represents the mean luminescence signal of an FBP with Luz driven by the 35S promoter. The gray background represents the night period. The dashed black line highlights where we expect to see the peak expression from the ODO1 promoter. Representative images of petunia flowers infiltrated with the pODO1:Luz at minimum and maximum bioluminescence are also shown, where luminescence signal is overlaid on the bright field image. (B) A schematic of the Luz expression cassette being driven by flower specific diurnal promoter of the petunia gene, ODO1, which is expected to have peak expression at the day to night transition. (C) Time course luminescence data from long day entrained P. hybrida flowers that were infiltrated with an FBP with Luz driven by the ODO1 promoter, 1 and 2 days post infiltration (n = 7 for both) is shown in orange. The time course luminescence data from controls imaged in parallel that were infiltrated with an FBP with Luz driven by the 35S promoter, 1 (n = 4) and 2 (n = 3) days post infiltration is also shown, in blue. The solid lines are mean luminescence and light outlines represent standard deviation. Time (hours) shows Zeitgeber time (time after the light onset at 9AM). The gray background represents the night period. The dashed black line highlights where we expect to see the peak expression from the ODO1 promoter. (D) Box plots summarizing when we observe peak luminescence signal in the time course luminescence data shown in C. Each dot represents an independent biological replicate of a flower infiltrated with a pathway that contains either pODO1:Luz (orange) or p35S:Luz (blue). The gray background represents the night period. The dashed black line highlights where we expect to see the peak expression from the ODO1 promoter. The reported p value was calculated based on a t-test.

