. 2020 Mar 31;9:e53514. doi: 10.7554/eLife.53514

Figure 1. Photoinduced observed difference electron density features are focused on the chromophore binding pocket.

(a) The observed difference electron density map at 1 ps is displayed together with the DrBphPdark structure. Red and green electron density peaks, contoured at 4.5 σ, denote negative and positive densities, respectively. Monomer A is colored blue and monomer B is in aqua. (b) Schematic illustration of the biliverdin chromophore. The hydrogen-bonding networks between the propionate groups and the protein are marked with dashed lines. In DrBphP, the chromophore is covalently linked to a cysteine residue in the PAS domain (solid line).

Figure 1.

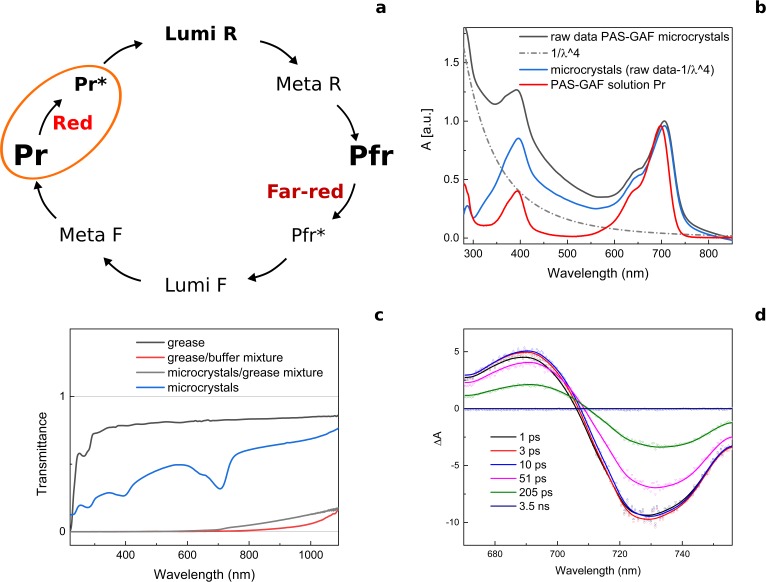
Figure 1—figure supplement 1. The photocycle of Deinococcus radiodurans phytochrome (DrBphP) and the spectral properties of its PAS-GAF fragment in the microcrystalline form.

Figure 1—figure supplement 1.

(a) Schematic illustration of the photoconversion between Pr and Pfr states in DrBphP. We note that the final state of the PAS-GAF fragment (also referred to as chromophore-binding domain, CBD) does not have the same spectral shape as in full-length phytochromes. (b) Raw absorption spectra of the DrBphPCBD microcrystals in buffer (black), scattering correction (1/λ4, dash dot), scattering corrected absorption spectra of the DrBphPCBD microcrystals (blue), and DrBphPCBD in solution in the Pr-state (red). (c) Transmission spectra of the grease (black), grease mixed with crystallization buffer (red), DrBphPCBD microcrystals in the grease matrix (measured in the 50 µm path length), and DrBphPCBD microcrystals in buffer. The microcrystals delivered to the beam are mixed with a viscous grease media. Although the Super Lube grease used in SFX experiments has a low background for X-rays, once it is mixed with the aqueous crystal buffer, the microcrystal/grease mixture exhibits significant scattering of visible light. The scattering varied with the mixing procedure. For the optical measurements, we reproduced the mixing procedure used at the XFEL as closely as possible. We estimate that the light intensities inside the grease jet are attenuated by at least two orders of magnitude. (d) Transient absorption spectra of DrBphPCBD microcrystals in buffer taken at different time delays after excitation. The spectra show a typical excited state signal of phytochromes (Toh et al., 2010). A Lumi-R signal was not observed, which is typically present on the ns-timescale after the excitation in the transient optical absorption data of phytochromes in solution.

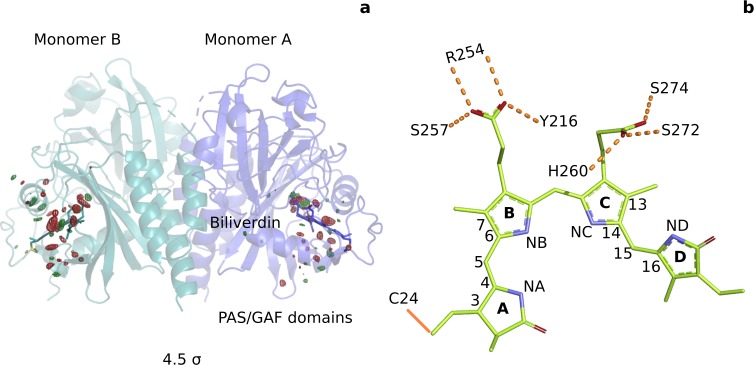
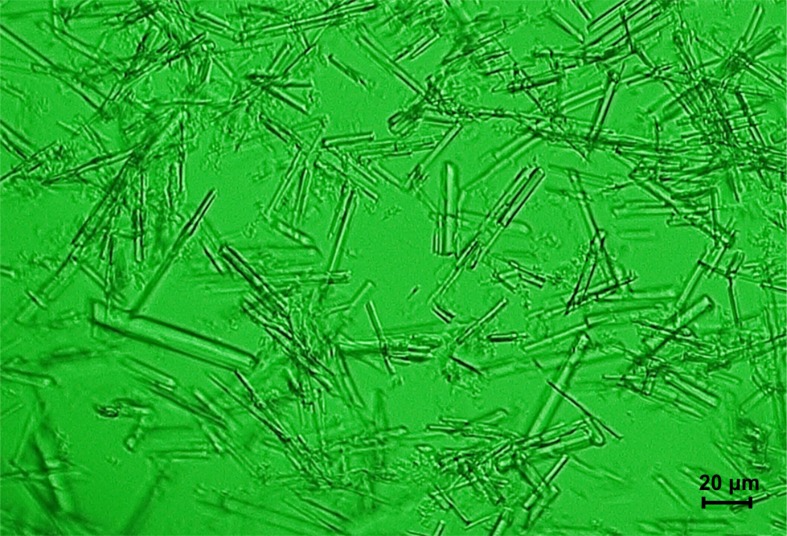
Figure 1—figure supplement 2. Microcrystals used for SFX data acquisition in SACLA.

Figure 1—figure supplement 2.

The crystals reported here were shaped as needles of 20–70 µm.

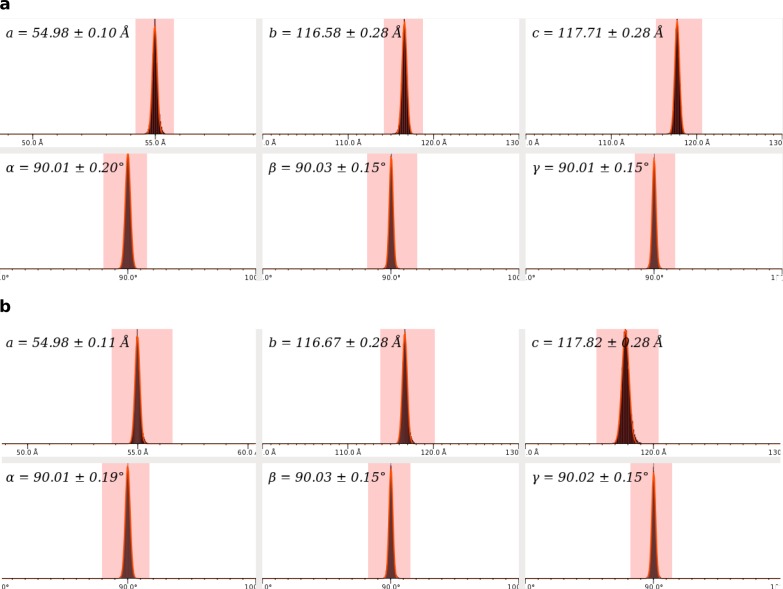
Figure 1—figure supplement 3. Unit cell parameters distribution of SFX data sets.

Figure 1—figure supplement 3.

(a) Unit cell parameters for dark data set. (b) Unit cell parameters for 1 ps data set. Both data sets indicate orthorhombic crystals.

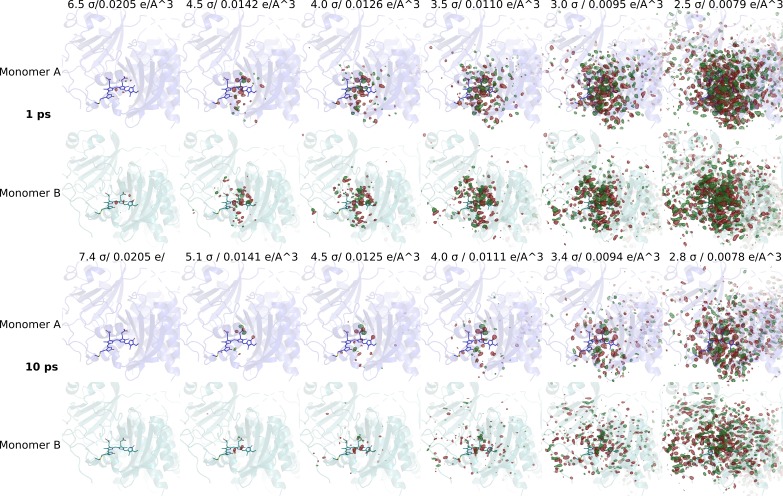
Figure 1—figure supplement 4. Significant difference electron density features observed.

Figure 1—figure supplement 4.

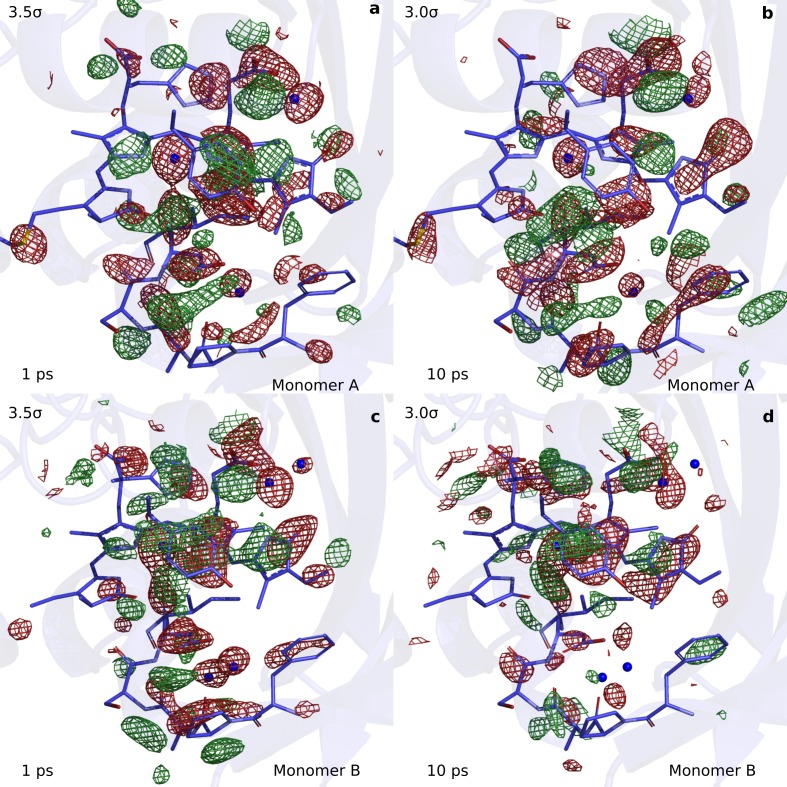
Difference electron density maps at 1 ps and 10 ps for monomer A and B are shown together with the DrBphPdark structure (monomer A: blue, monomer B: aqua). Red and green contour surfaces denote negative and positive densities, respectively. The maps are contoured at electron density levels as indicated. We determine the background level to be at 3σ for 1 ps and at 3.4σ for 10 ps, since below these levels random signals outside the chromophore region appear.

Figure 1—figure supplement 5. Comparison of the observed difference electron density maps at 1 ps and 10 ps.

Figure 1—figure supplement 5.

The observed difference electron density map at (a) 1 ps plotted for monomer A, (b) at 10 ps for monomer A, (c) at 1 ps monomer B, and (d) at 10 ps for monomer B. The maps are plotted at 3.5σ and 3σ for 1 ps and 10 ps, respectively. Most off the difference features discussed here are present in both maps, although at a lower signal strength in the 10 ps map.