. 2020 Mar 31;9:e53514. doi: 10.7554/eLife.53514

Figure 3. Observed and calculated difference electron densities reveal a twist of the D-ring and significant protein rearrangements.

The observed difference electron density with the refined DrBphPdark(blue) and DrBphP1ps(beige) structures, shown for (a) the B-, C-, and D-ring surroundings, (b) the strictly conserved His260 and Tyr263, and (c) the D-ring. The calculated difference electron density shown for (d) His260 and Tyr263 and (e) the D-ring. The D-ring twists counter-clockwise when viewed along C15-C16 bond toward the C-ring. The observed difference electron density is contoured at 3.3 σ. And the calculated difference electron density is contoured at 3.5 and 5.0 σ for panel d and e, respectively. Monomer A is shown in this figure.
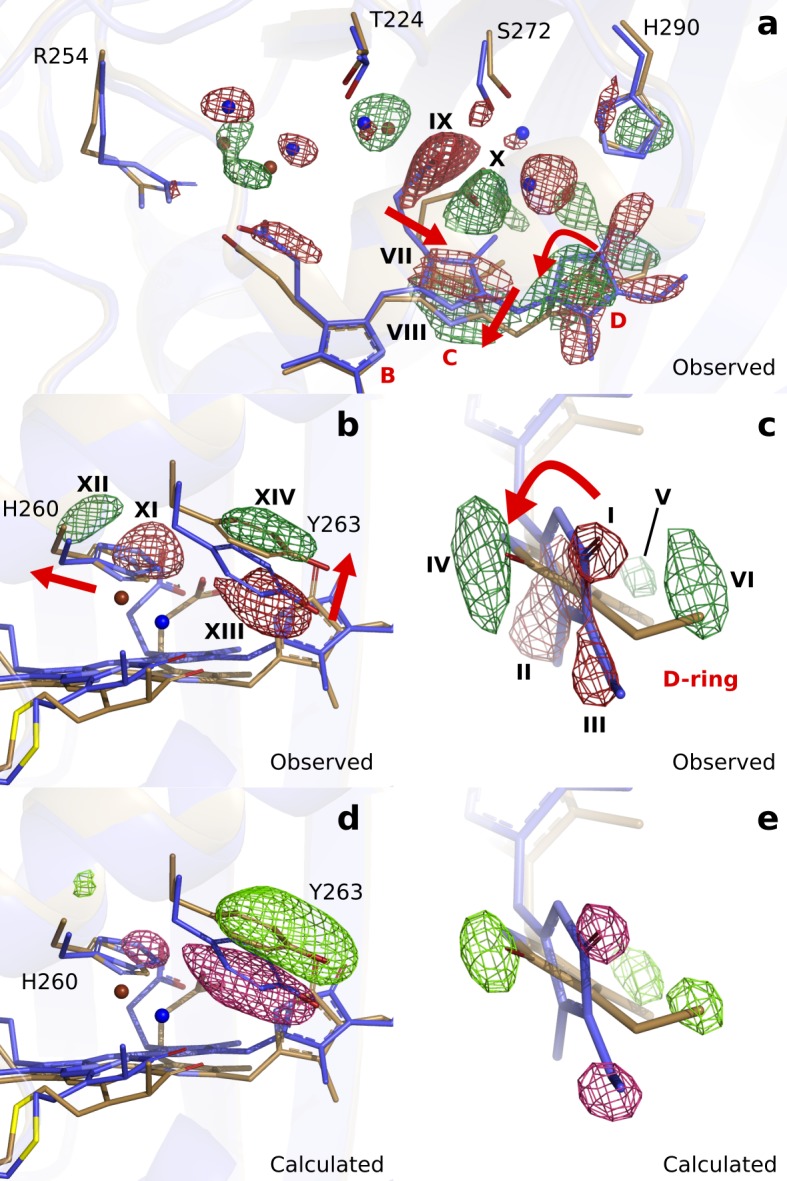
Figure 3.

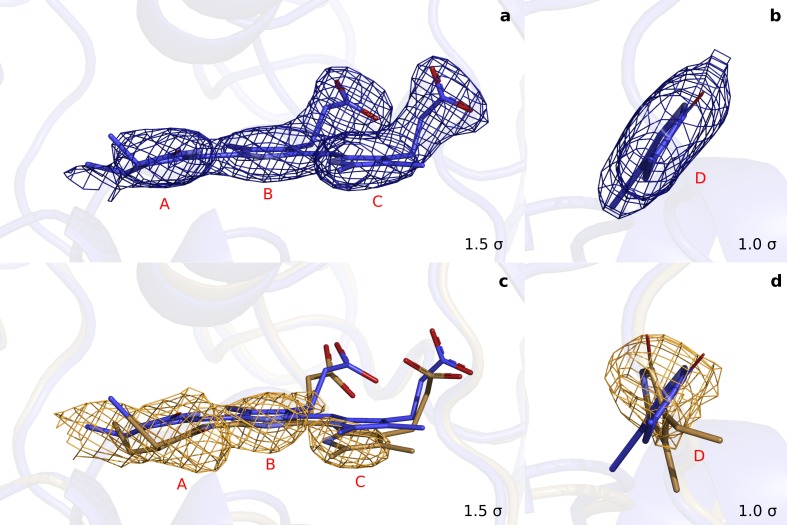
Figure 3—figure supplement 1. Extrapolated maps at α=25 demonstrate that the D-ring twists in the photoactivated state.

Figure 3—figure supplement 1.

(a). Rings A to C of monomer A together with the 2Fo-Fc maps of the refined dark structure (DrBphPdark: blue). (b). The same data for the D-ring in a different orientation. (c) and (d). Equivalently, the refined structure (DrBphP1ps: beige) of the chromophore in monomer A together with the extrapolated map FT(Fe) at 1 ps. (Fo, phases from the dark structure). We observed a round-shape feature for the D-ring, but flat densities for C-ring (downward shift) and B-ring (almost unshifted). This suggests that the D-ring twists significantly. For the A-ring we observe a broad density, with the strongest contribution indicating a twisted or tilted ring.

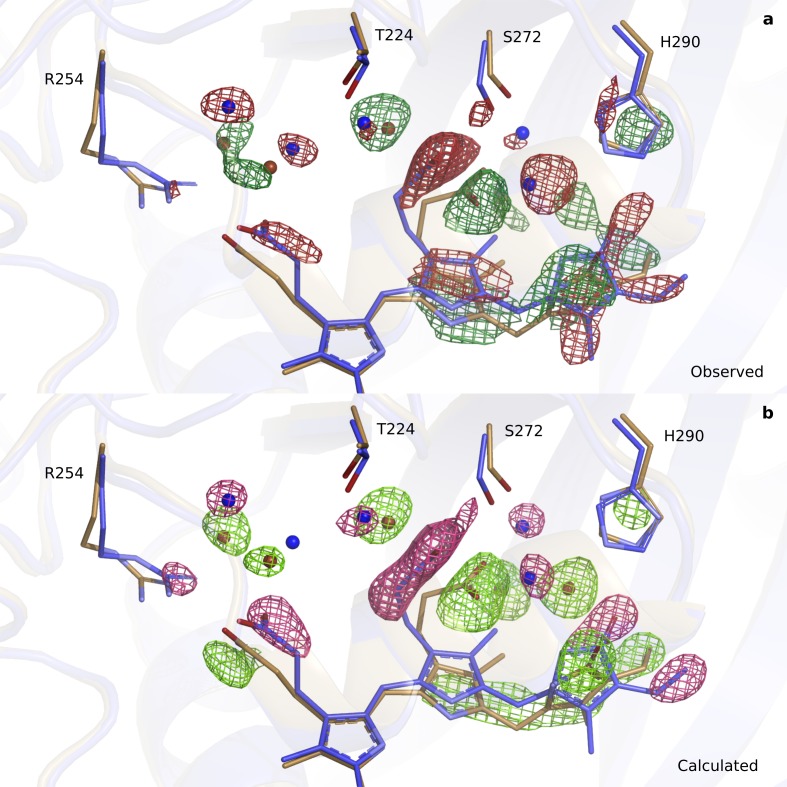
Figure 3—figure supplement 2. Comparison of observed (upper panel) and calculated (lower panel) difference electron densities indicate good agreement around the B-D rings.

Figure 3—figure supplement 2.

(a). The observed difference electron density map (3.3 σ) is displayed for the B-D ring surroundings of the DrBphPdark (blue) and the DrBphP1ps structure (beige) for monomer A. (b). The same view and structures displayed with the calculated difference electron density map contoured at 4.5 σ.

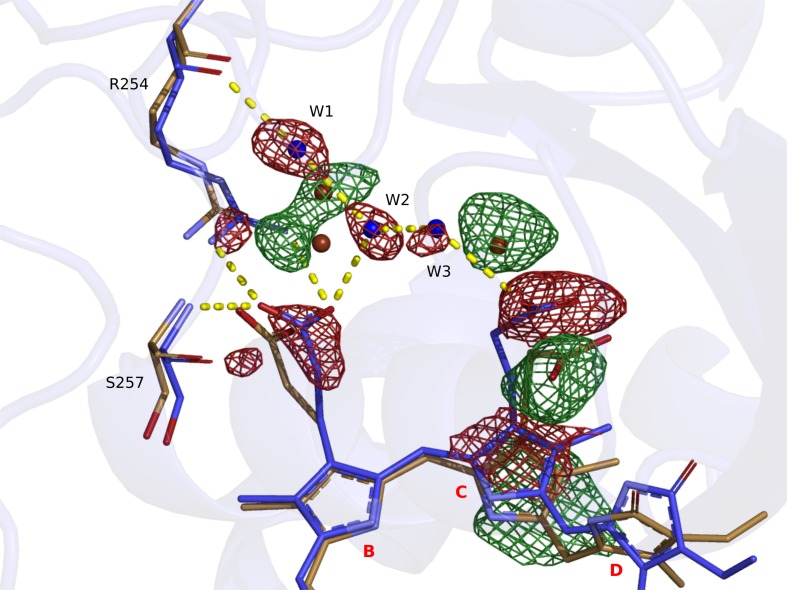
Figure 3—figure supplement 3. Hydrogen bonding network between the chromophore propionate groups is disrupted at 1 ps delay time.

Figure 3—figure supplement 3.

Correlating negative and positive density features indicate that the C-ring moves downwards, together with the C-ring propionate. The negative density features located on the propionate groups, three waters (W1, W2 and W3), Arg254, and Ser257 collectively indicate that the hydrogen bonding network is resolved at 1 ps. Difference electron density features are not observed on the B-ring. DrBphPdark is shown in blue and DrBphP1ps in beige. The chromophore is shown for monomer A together with the observed difference map at 1 ps delay time, contoured at 3.0 σ.

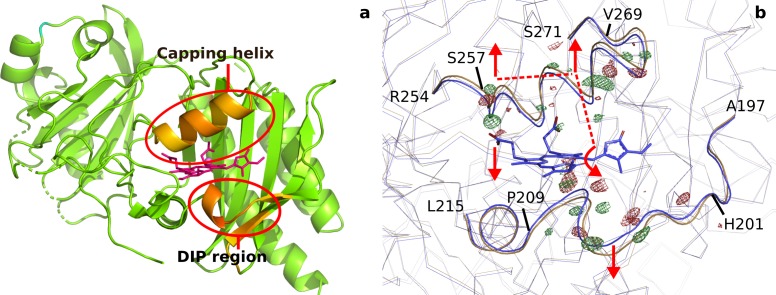
Figure 3—figure supplement 4. Backbone movements at 1 ps.

Figure 3—figure supplement 4.

(a). Difference (DrBphP1ps-DrBphPdark) in distances between each Cα and the pyrrole water (DrBphPdark) plotted for all differences that are larger than 0.45 Å for monomer B. Longer distances are colored red and biliverdin is shown as pink sticks. The regions that move the most, the ’DIP region’ and the ’capping helix’ above the chromophore are marked with red circles. (b). The observed difference electron densities indicate backbone movements away from the chromophore for residues 201–209 and 257–269, and an expansion of the chromopore-binding pocket. The DrBphPdark structure is colored blue and the DrBphP1ps structure is colored beige. The observed electron density map is contoured at 4.0 σ. The dashed lines indicate the proposed signal transduction pathway from D-ring to B-ring propionate.