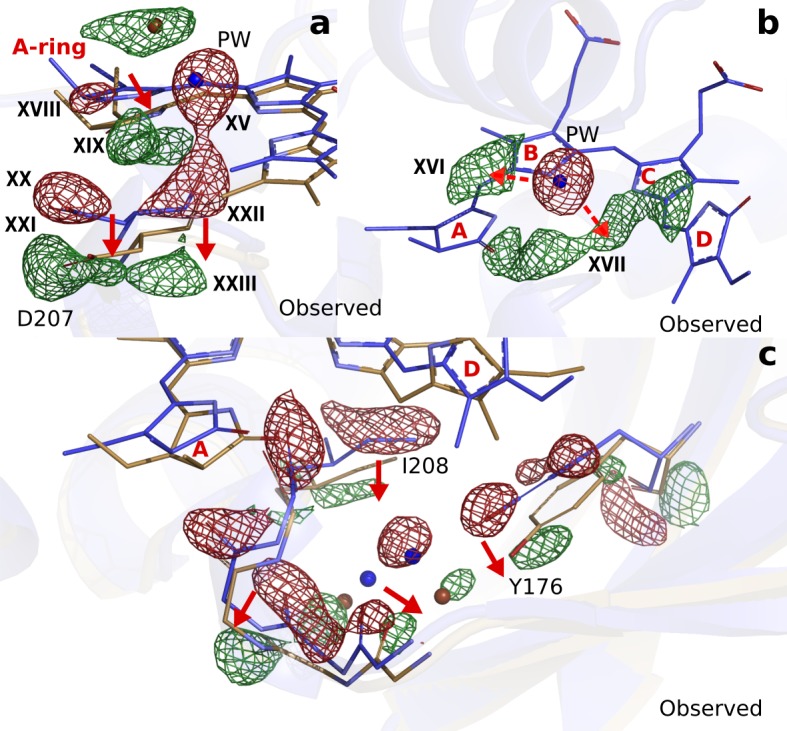
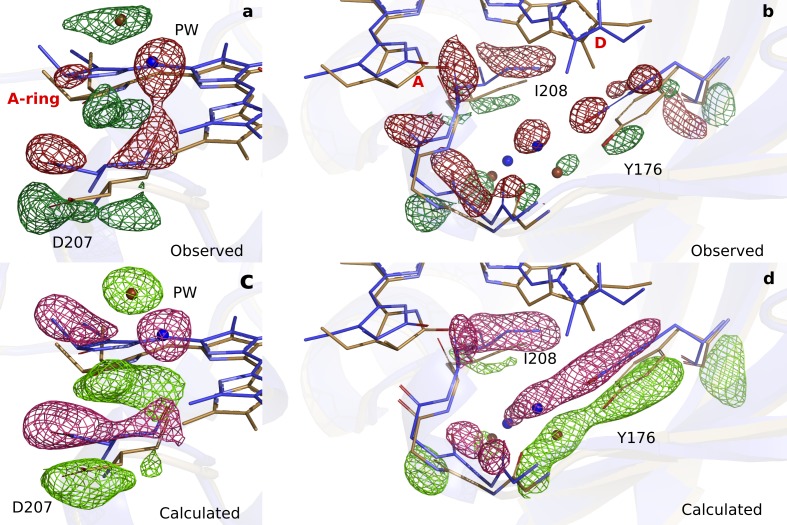
Figure 4. Photodissociation of the pyrrole water, displacement of the A-ring and its effect on the proteins scaffold.
(a). The observed difference electron density displayed with the DrBphPdark (blue) and DrBphP1ps (beige) structures around the A-ring, Asp207 and pyrrole water (PW). The structural model was inconclusive as to whether the A-ring twists around the double bond between the B- and A-ring, or whether it tilts downward hinged on the connection between C- and B-ring. (b). The regions of the pyrrole water (PW) and the area between the pyrrole rings show negative and positive densities, respectively. The observed difference electron density is contoured at 3.3σ. (c). Density displayed for the backbone below the A-ring, including side chains of the strictly conserved Ile208 and Tyr176 as well as the surrounding water network. Monomer A is shown in this figure.


