
Fig. 2. Effects of SNC elasticity on cellular interactions.
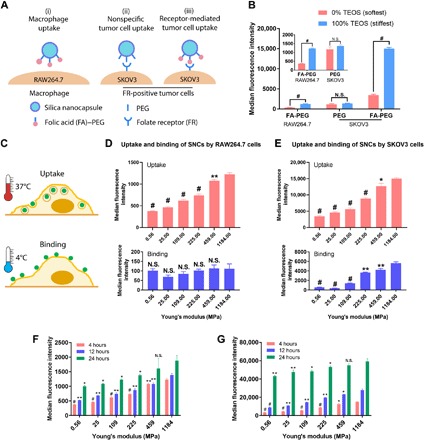
(A) Schematic illustration showing different types of cell-SNC interactions. (B) The uptake of the softest and the stiffest SNCs by RAW264.7 and SKOV3 cells; inset is the magnified graph of the first two groups. (C) The cellular uptake and binding of SNCs were measured at 4° and 37°C, respectively. (D) Four-hour cellular uptake and binding of FA-PEG–modified SNCs in RAW264.7 and (E) SKOV3 cells; values are compared to the SNCs having the highest Young’s modulus. (F) Four-, 12-, and 24-hour cellular uptake of FA-PEG–modified SNCs in RAW264.7 and (G) SKOV3 cells; at every time point, values are compared to the SNCs having the highest Young’s modulus. All values are means ± SD (n = 3, with *P < 0.05, **P < 0.01, and #P < 0.001; N.S., not significant).