. 2020 Apr 1;9:e51576. doi: 10.7554/eLife.51576

Figure 1. Single cell RNA sequencing reveals heterogeneity of the human satellite cell transcriptome.

(a) Schematic diagram of the process of isolating human satellite cells from muscle biopsies, and then performing single cell RNA-seq to develop single cell transcriptomes leading to discovery of cell clusters, followed by in vivo validation. (b) UMAP plot of 68,108 cells isolated from eight vasti lateralis of male and female healthy subjects. Cells are clustered according to transcriptome similarity in 2D space. Each dot represents one cell, which are colored by cluster as identified by clustering analysis. (c) UMAP of each individual sample showing the distribution of cells in clusters for each sample. (d–f) Dot plots displaying expression of individual genes within each cluster. Each cluster is depicted on the y-axis and genes are labeled on the x-axis. Larger dot size represents more cells of that cluster expressing each gene; while color indicates the level of expression within those cells. (d) Dot plot displaying expression of genes associated with myogenesis, mesenchymal and hematopoietic markers in clusters 0–16. (e) Dot plot displaying the expression of top differentially expressed cluster markers in clusters 0–16. (f) ‘Road-UMAP’ with labeled cell types and key significantly regulated markers.

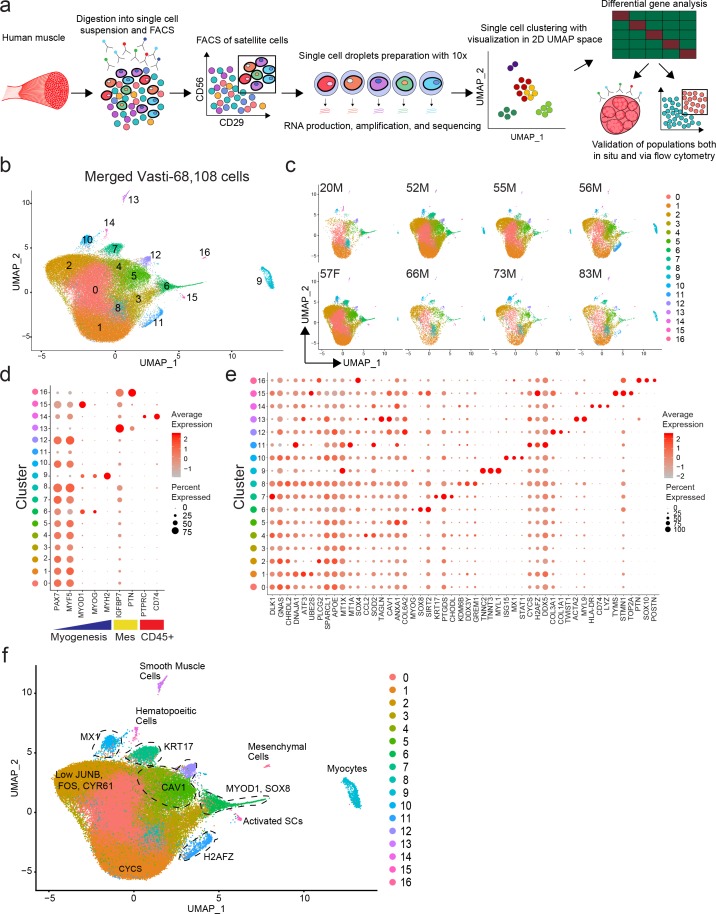
Figure 1—source data 1. Single cell RNA sequencing reveals heterogeneity of the human satellite cell transcriptome.

Figure 1.

Figure 1—figure supplement 1. Flow cytometric sorting of CXCR4+/CD29+/CD56+ human satellite cells and quality control data from single cell RNA-sequencing experiments.

Figure 1—figure supplement 1.

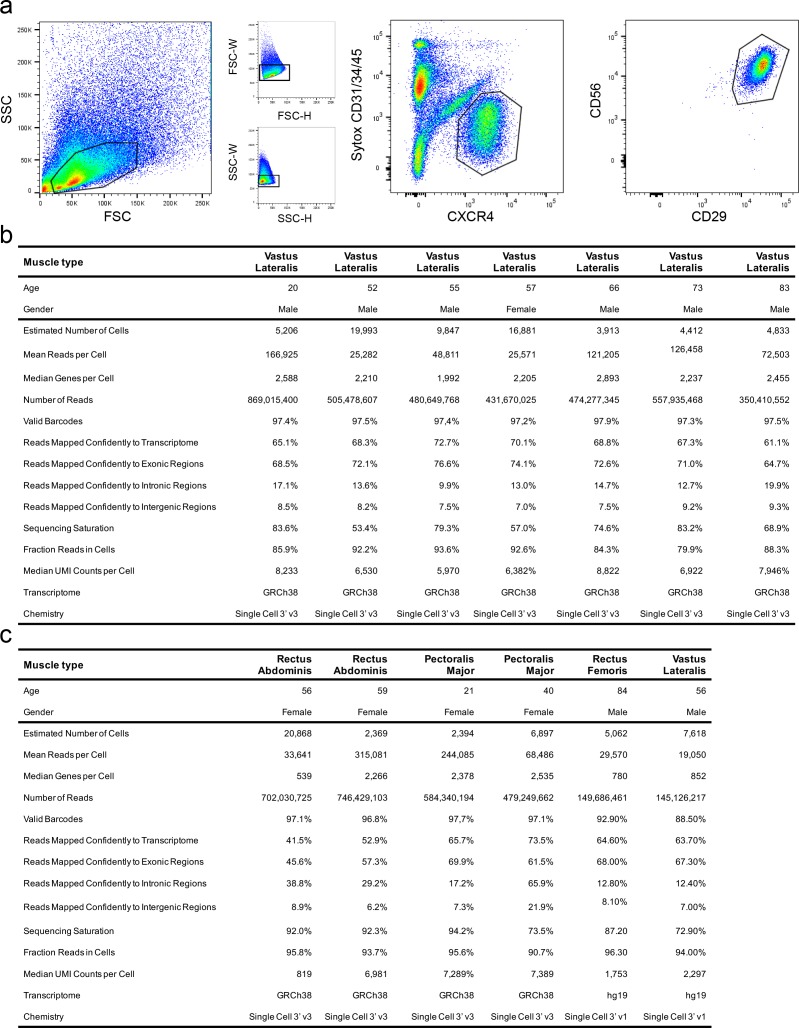
(a) Flow cytometry profiles from the isolation of CXCR4/CD29/CD56 human satellite cells from vastus lateralis muscle of a 55 year old male. (b–c) Quality control metrics for each of the single cell RNA-sequencing experiments of cells isolated from an 84 year old male (left) and a 56 year old male (right).
Figure 1—figure supplement 2. PAX7/3 expression in vasti lateralis and transcriptome from a rectus femoris muscle of human satellite cells.

Figure 1—figure supplement 2.

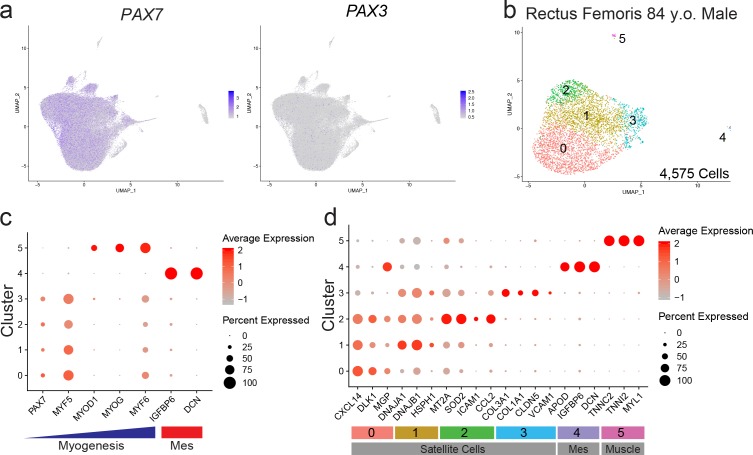
(a) Feature map displaying the expression of PAX7 and PAX3 of satellite cells in eight pooled vasti lateralis human muscle. Of Note while the rectus femoris sample was prepared with the Chromium Single Cell 3' Reagent v1 kit, we found that the newer 3' Reagent v3 detected some genes including PAX7 with greater sensitivity. (b) UMAP of 5,062 cells isolated from the quadriceps muscle of a 84-year-old male. Cells are clustered according to transcriptome similarity in 2D space. Each dot represents one cell which are colored by cluster as identified by clustering analysis. (c) Dot plots displaying expression of individual genes within each cluster. Each cluster is depicted on the y-axis and genes are labeled on the x-axis. Larger dot size represents more cells of that cluster expressing each gene; while color indicates the over level of expression within those cells. (d) Dot plot displaying expression of genes associated with myogenesis and mesenchymal markers in clusters 0–5. (e) Dot plot displaying the expression of top differentially expressed cluster markers in clusters 0–5 similar to the eight vasti lateralis.