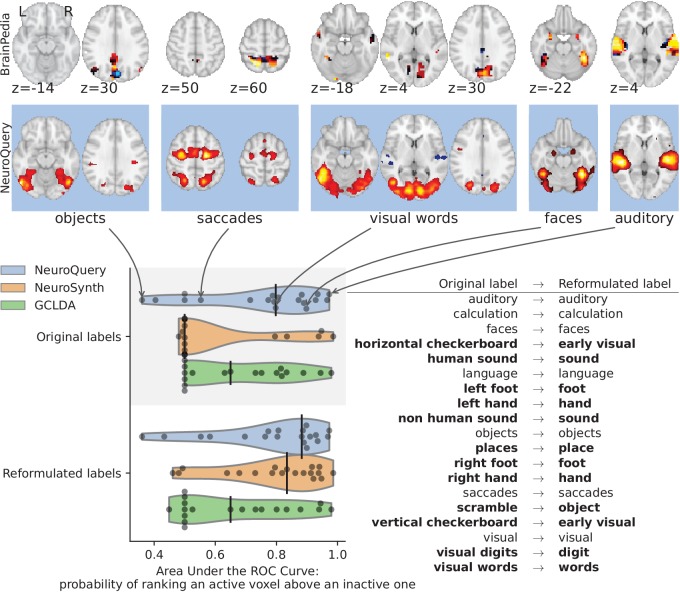
Figure 13. Comparison of CBMA maps with IBMA maps from the BrainPedia study.
We use labelled and thresholded maps resulting from a manual IBMA. The labels are fed to NeuroQuery, NeuroSynth and GCLDA and their results are compared to the reference by measuring the Area under the ROC Curve. The black vertical bars show the median. When using the original BrainPedia labels, NeuroQuery performs relatively well but NeuroSynth fails to recognize most labels. When reformulating the labels, that is replacing them with similar terms from NeuroSynth’s vocabulary, both NeuroSynth and NeuroQuery match the manual IBMA reference for most terms. On the top, we show the BrainPedia map (first row) and NeuroQuery prediction (second row) for the quartiles of the AUC obtained by NeuroQuery on the original labels. A lower AUC for some concepts can sometimes be explained by a more noisy BrainPedia reference map.

