
Figure 3. Pharmacological inhibition of LIN9 expression potentiates paclitaxel-induced cell death.
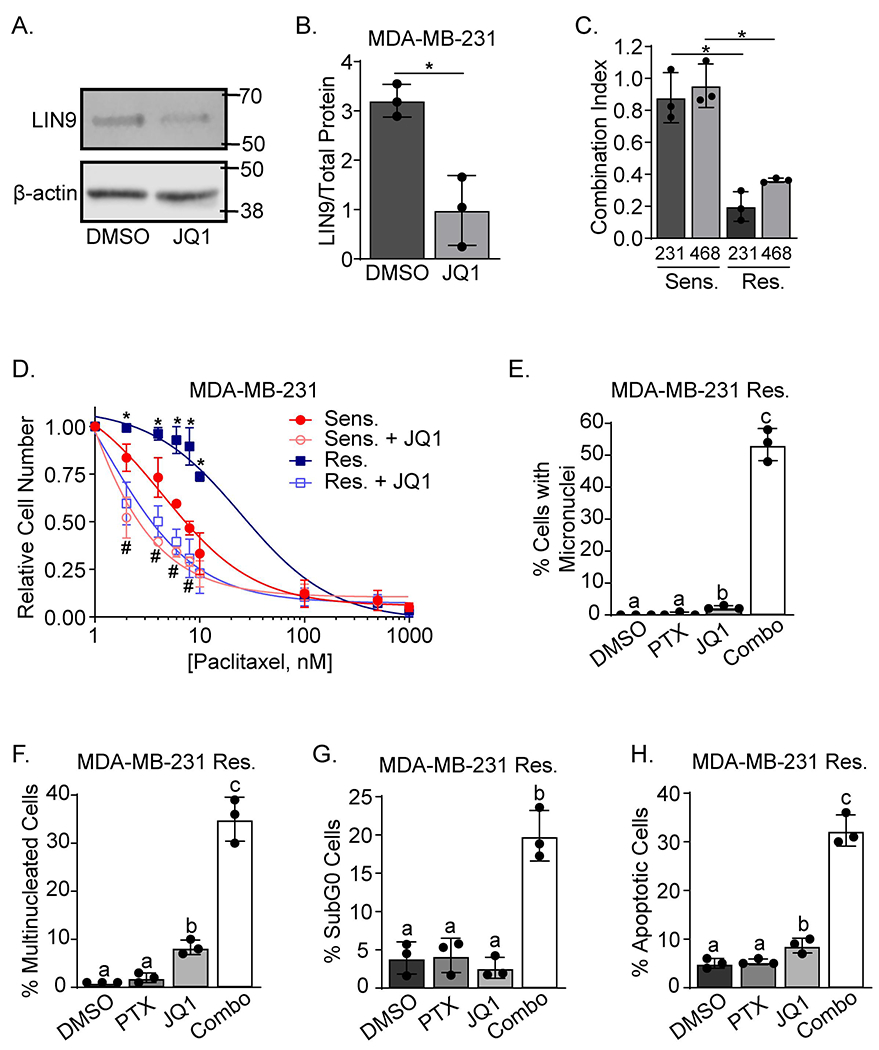
A. Western blot analysis of LIN9 or β-actin expression in MDA-MB-231 cells treated with 250nM JQ1 or vehicle for 24 hr. B. Quantitation of LIN9 protein relative to vehicle treated cells after normalization to total protein, *=p<0.05. C. The Chou-Talalay method was used to assess drug synergy between paclitaxel (6nM) and JQ1 (250nM) after 4 days of treatment in both MDA-MB-231 and MDA-MB-468 PTX sensitive/parental and resistant cell lines. *=p<0.05 comparing the PTX sensitive/parental to PTX resistant cells in each cell line. D. MDA-MB-231 sensitive/parental and resistant cells were treated with 250nM JQ1 and increasing concentrations of paclitaxel for 4 days. Live cells were counted using trypan blue exclusion. *=p<0.05 comparing paclitaxel alone to combination treatment in PTX resistant cells, and #=p<0.05 comparing paclitaxel alone to combination treatment in MDA-MB-231 sensitive/parental cells. E and F. MDA-MB-231 resistant cells were treated with 6nM Paclitaxel and/or 250nM JQ1 for 4 days and stained with DAPI and Texas Red-X phalloidin. The percent of cells with E. micronuclei and F. multinucleated cells were counted. Distinct letters above bars indicate significant differences between groups with different letters (p<0.05). A minimum of 150 cells were counted per experiment. G. MDA-MB-231 resistant cells were treated for 4 days with 6nM paclitaxel and/or 250nM JQ1, stained with propidium iodide, and analyzed using flow cytometry, *p<0.05 combination compared to individual drugs. H. MDA-MB-231 resistant cells were treated for 4 days, stained with Hoescht, and the number of pyknotic relative to normal nuclei were counted. Distinct letters above bars indicate significant differences (p<0.05). All data are means ± SD and were repeated in 3 independent experiments in triplicate.