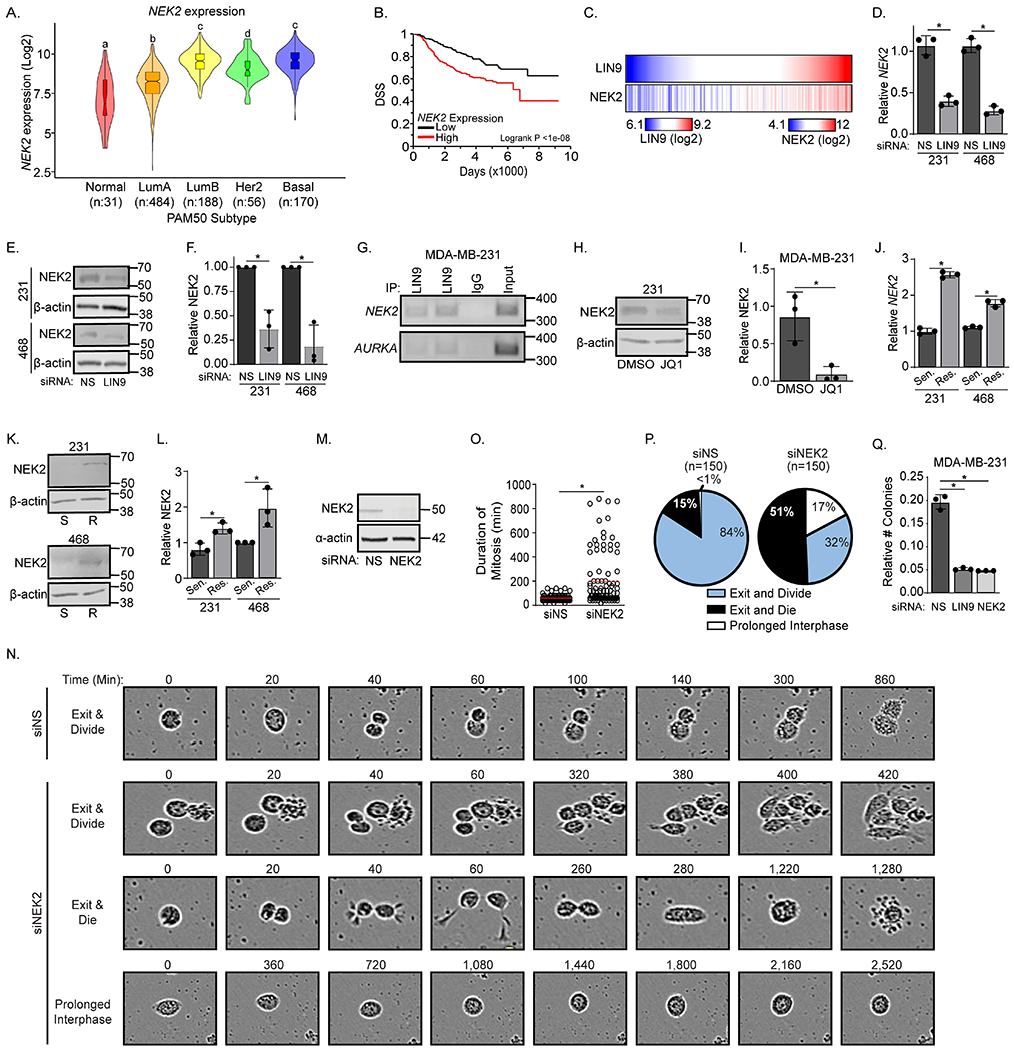
Figure 4. NEK2 is a transcriptional target of LIN9 that is associated with taxane resistance.

A. NEK2 expression (Log2) in the five PAM50 subtypes after interrogation of the TCGA dataset (LumA=Luminal A, and LumB=Luminal B). Boxplot lines indicate quartiles and distinct letters above bars indicate significantly different values from all groups (p<0.05). B. Disease specific survival curve for breast cancer patients with high or low NEK2 expression using the METABRIC dataset21. C. Heat maps of gene expression indicating a correlation of NEK2 and LIN9 from the TCGA dataset where each vertical line represents one breast cancer patient50. D. RT-qPCR analysis of NEK2 in MDA-MB-231 and MDA-MB-468 cells 3 days after siLIN9 or siNS transfection. E. Western blot of NEK2 expression in MDA-MB-231 and MDA-MB-468 cells 3 days after siLIN9 or siNS transfection. F. Quantification of the western blot in panel E relative to total protein G. Representative gene-specific ChIP-PCR gel of MDA-MB-231 cells assessing the binding of LIN9 to the NEK2 gene and the positive control gene, AURKA. H. Western blot of NEK2 expression in MDA-MB-231 cells after 24-hr of DMSO or 250nM JQ1, normalized to total protein. I. Quantitation of the western blot in panel H relative to total protein. J. RT-qPCR analysis of NEK2 expression in PTX sensitive/parental and resistant MDA-MB-231 and MDA-MB-468 cell lines. K. Western blot of NEK2 expression in PTX sensitive (S) or PTX resistant (R) MDA-MB-231 and MDA-MB-468 cell lines, normalized to total protein. L. Quantitation of NEK2 western blot in panel K normalized to total protein. M. Western blot indicating NEK2 silencing in MDA-MB-468 cells. N. Representative live cell images used for quantitation of cell fates of MDA-MB-468 cells transfected with siNS or siNEK2. Numbers indicate minutes from the first image displayed. O. Quantitation of the length of time for individual MDA-MB-468 cells to complete mitosis when NEK2 is silenced. The red line indicates the mean. P. Pie charts demonstrating the percent of MDA-MB-468 cells transfected with siNS or siNEK2 that underwent different cell fates: exit and divide (blue), exit and die (black), and prolonged interphase (white). Q. MDA-MB-231 sensitive/parental cells were transfected with siNS, siLIN9, or siNEK2 and examined for their ability to form colonies. Colonies were stained with crystal violet, and the absorbance of each well was measured, *p<0.05 siLIN9 and siNEK2 compared to control. For D-L and Q, data are means ± SD, *=p<0.05 and were repeated in 3 independent experiments in triplicate.
