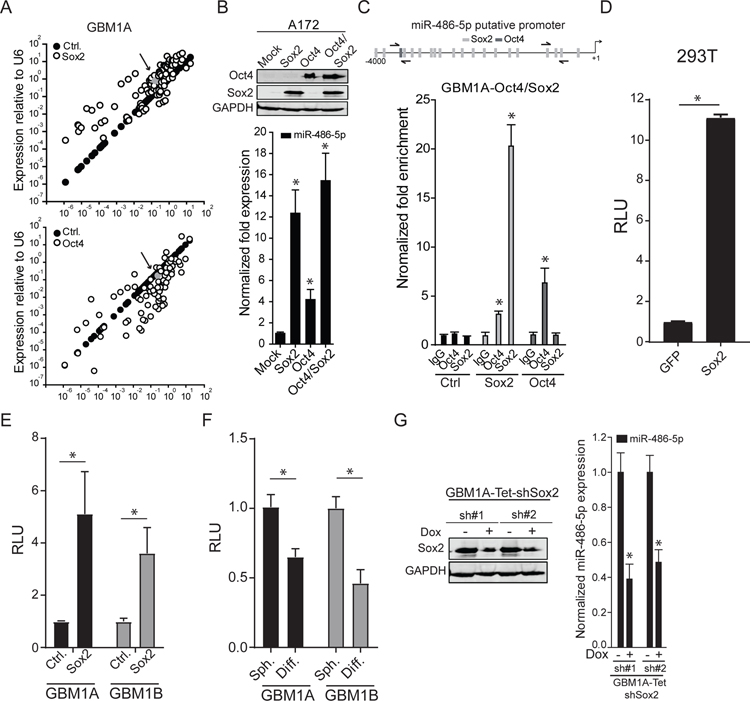
Figure 2: miR-486–5p is regulated by SOX2.
(A) Differential miRNA expression was determined in GBM1A neurospheres expressing Oct4 or Sox2 relative to control GBM1A spheres using a Human Brain Cancer miRNA PCR array. Arrow points at grey dot indicating miR-486–5p expression. (B) Western blot showing relative expression of Sox2 and Oct4 (top panel). qRT-PCR to measure expression of mature miR-486–5p 3 days after exogenous expression of Oct4, Sox2, or the combination. (C) Oct4 and Sox2 binding sites on human miR-486–5p promoter, arrows indicate primer sites used for PCR analyses (top panel). DNA purified from chromatin immuno-precipitation was analyzed by qRT-PCR using primer pairs designed to amplify fragments containing Oct4, Sox2, or a control region lacking binding sites for either transcription factor (bottom panels). (D) 293T cells were co-transfected with a luciferase reporter construct spanning the miR-486–5p putative promoter containing the SOX2 binding sites and GFP or SOX2. (E) GBM neurosphere isolates expressing exogenous SOX2 were transfected with the luciferase reporter construct spanning the miR-486–5p putative promoter containing the SOX2 binding sites and luciferase activity was measured 3 days after transfection. (F) GBM1A and GBM1B neurospheres were transfected with luciferase reporter construct covering the miR-486–5p putative promoter containing the SOX2 binding and forced to differentiate. Luciferase activity was measured 3 days after differentiation. (G) Western blot to measure expression of Sox2 (top panel) and qRT-PCR to measure expression of pre-miR-486–5p (bottom panel) 3 days after doxycycline treatment. Student’s t-test was used to calculate statistical significance in panels D,E,F, and G; One-way ANOVA with Tuckey’s post hoc test was used calculate statistical significance in panels B and C. Data are presented as means ± S.D *p< 0.05

