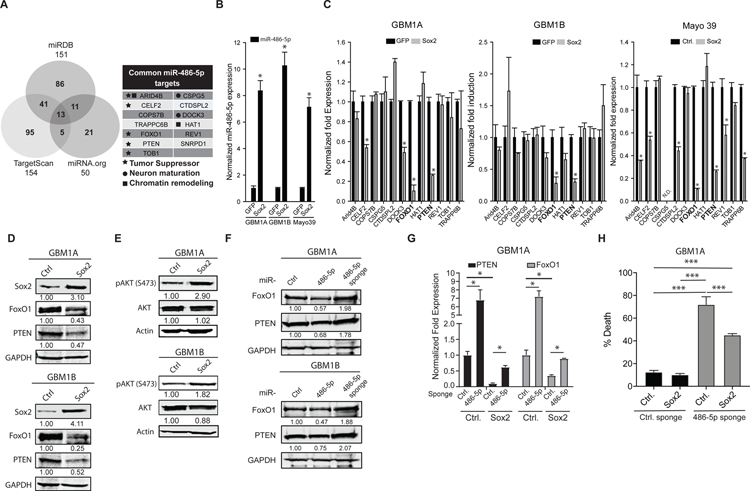
Figure 3: Sox2:miR-486–5p axis down-regulates tumor suppressor genes in GBM neurospheres.
(A) Venn diagram showing intersection of miR-486–5p target genes using 3 different prediction algorithms (right panel). List of high-confidence miR-486–5p target genes (left panel). (B) qRT-PCR to measure expression of mature miR-486–5p in GBM neurosphere cells expressing transgenic Sox2. (C) qRT-PCR to measure gene levels of high-confidence miR-486–5p target genes in GBM neurospheres expressing transgenic Sox2. Genes highlighted in bold (FOXO1, PTEN) were commonly regulated in 3 distinct GBM neurosphere isolates. (D) Western blot analysis to measure PTEN and FoxO1 protein levels in GBM neurospheres expressing transgenic Sox2. (E) Western blot analysis to measure AKT and pAKT protein levels in GBM neurospheres expressing transgenic Sox2. (F) Western blot analysis to measure PTEN and FoxO1 protein levels in GBM neurospheres 4 days after expressing transgenic miR-486–5p or miR-486–5p inhibition (miR-486–5p sponge). (G) qRT-PCR to measure PTEN and FoxO1 expression in GBM neurospheres expressing transgenic SOX2 after miR-486–5p inhibition. (H) Trypan blue exclusion to measure cell death 4 days after miR-486–5p inhibition in in GBM neurospheres expressing transgenic SOX2. Student’s t-test was used to calculate statistical significance in panels B and C; One-way ANOVA with Tuckey’s post hoc test was used calculate statistical significance in panels H. Data are presented as means ± S.D *p< 0.05

