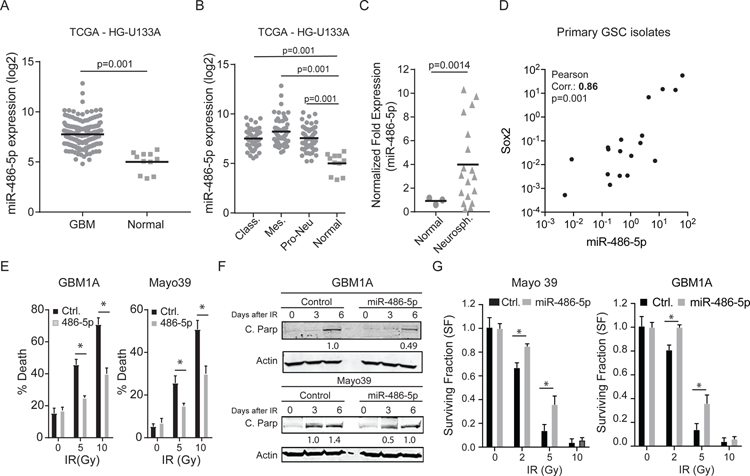
Figure 4: miR-486–5p is up-regulated in GBM and enhances resistance to IR treatment.
miR-486–5p expression data was retrieved from the TCGA database using the BETASTASIS portal (http://www.betastasis.com). (A) miR-486–5p levels in normal brain compared to GBM and (B) normal brain compared to GBM subtypes. (C) qRT-PCR to measure miR-486–5p expression in GBM neurospheres lines and primary GBM neurosphere isolates compared to non-tumorigenic glial progenitors (normal) (D) Positive correlation between miR-486–5p and Sox2 expression in primary GBM neurosphere isolates. Pearson coefficient analysis was applied to establish correlations from gene expression data. (E) GBM stem-like cells stably expressing miR-486–5p or a control miRNA (Ctrl.) were treated with increasing doses of IR and cell death was quantified using trypan blue exclusion 3 days after treatment. (F) Western blot to measure cleaved PARP and cleaved Caspase 3 in GBM stem-like cells expressing transgenic miR-486–5p 3 and 6 days after IR (5Gy) treatment. (G) Clonogenic assay in GBM stem-like cells expressing transgenic miR-486–5p after IR treatment. Colonies were counted using Image J script 14 days after treatment. Student’s t-test was used to calculate statistical significance in panels B, C, and D; Two-way ANOVA with Tuckey’s post hoc test was used calculate statistical significance in panels E and G. Data are presented as means ± S.D *p< 0.05

