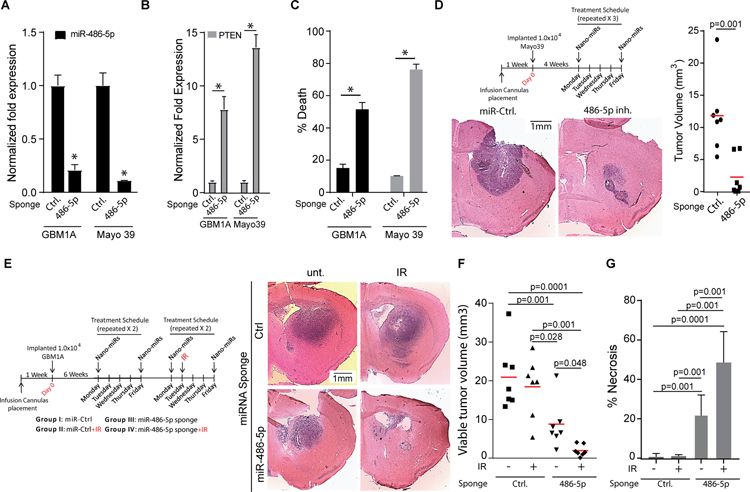
Figure 6: In vivo inhibition of miR-486–5p in pre-established GBM reduces tumor size and sensitizes tumors to IR treatment.
qRT-PCR analysis to quantify expression of miR-486–5p (A) or down-stream targets (B) in GBM1A and Mayo39 cells 3 days after transfection with nano-miRs delivering a non-targeting control miRNA (Ctrl.) or a miR-486–5p sponge. (C) Cell death assay to measure viability of GBM1A and Mayo 39 cells 6 days after transfections with nano-miRs delivering a non-targeting control miRNA (Ctrl.) or a miR-486–5p sponge. (D) Schematic summarizing treatment schedule for in vivo delivery of nano-miRs (top panel). Representative H&E stained brain sections from mice implanted with Mayo 39 cells (N=7 for each group) treated with the indicated nano-miRs. Animals were sacrificed 52 days after cell implantation. (E) Schematic summarizing treatment schedule for in vivo delivery of nano-miRs. (F) Representative H&E stained brain sections from mice implanted with GBM1A neurosphere cells (N=7 for each group) treated with the indicated nano-miRs +/− IR. Animals were sacrificed 70 days after cell implantation. Maximum tumor cross-sectional areas following treatment with nano-miRs representing viable tumor tissue (F) and necrotic tumor tissue (G) were quantified from H&E stained sections using ImageJ software. Student’s t-test was used to calculate statistical significance in panels A-D; One-way ANOVA with Tuckey’s post hoc test was used calculate statistical significance in panels F and G. Data are presented as means ± S.D *p< 0.05

