
Figure 3. A.
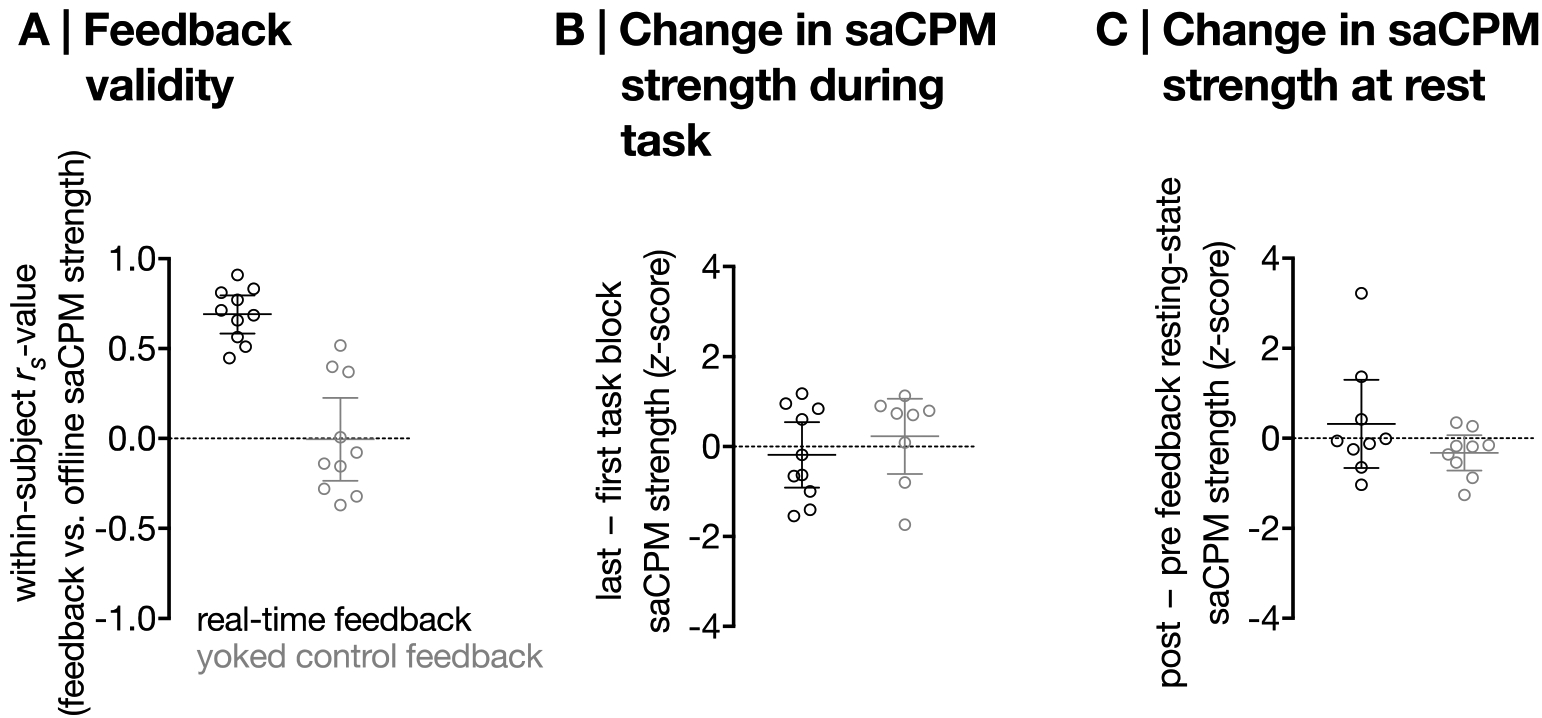
Correlation between saCPM strength calculated offline and feedback (for neurofeedback participants, akin to saCPM strength calculated online; group difference: t18 = 6.20, p = 7.55×10⁻⁶). Horizontal lines represent group means; error bars show 95% confidence intervals. B. Change in saCPM strength from the first to the last training task block in the neurofeedback and yoked control groups (group difference: t16 = −.86, p = .40, Cohen’s d = .43). C. Change in resting-state saCPM strength from pre- to post-feedback in the neurofeedback and yoked control groups (group difference: t16 = 1.41, p = .18, Cohen’s d = .71). Higher z-scores represent better improvements in functional connectivity signatures of attention.