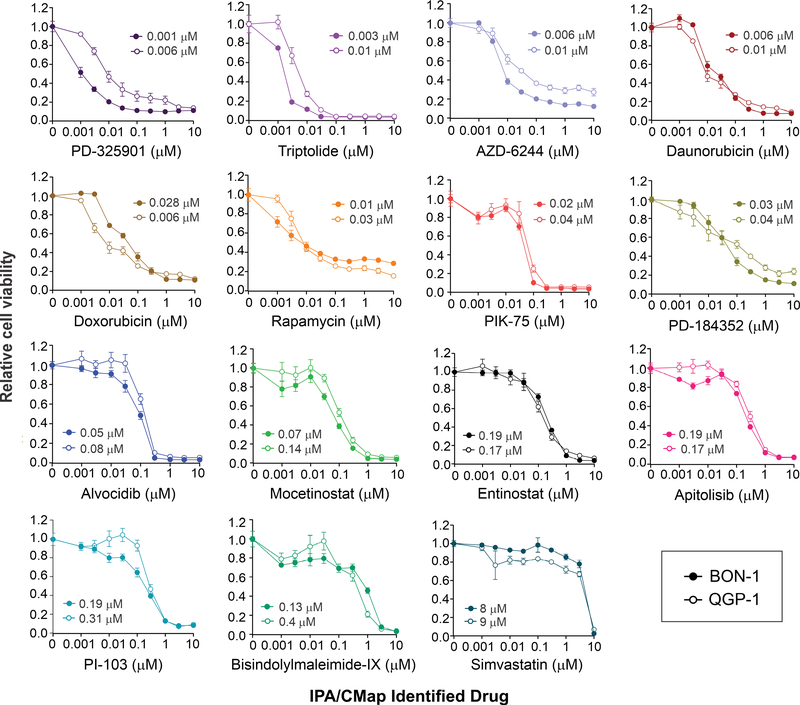
Figure 5:
Differential in vitro responsiveness of PNET cell lines to anti-cancer drugs suggested by the metastatic gene signature in patient PNETs. BON-1 (closed circles) and QGP1 (open circles) cells were exposed to increasing concentrations of the indicated drugs for five days. The proportion of viable cells is shown on the y-axis, with the dosage on the x-axis. The IC50 values (μM) are denoted for each drug.

