Figure 3:
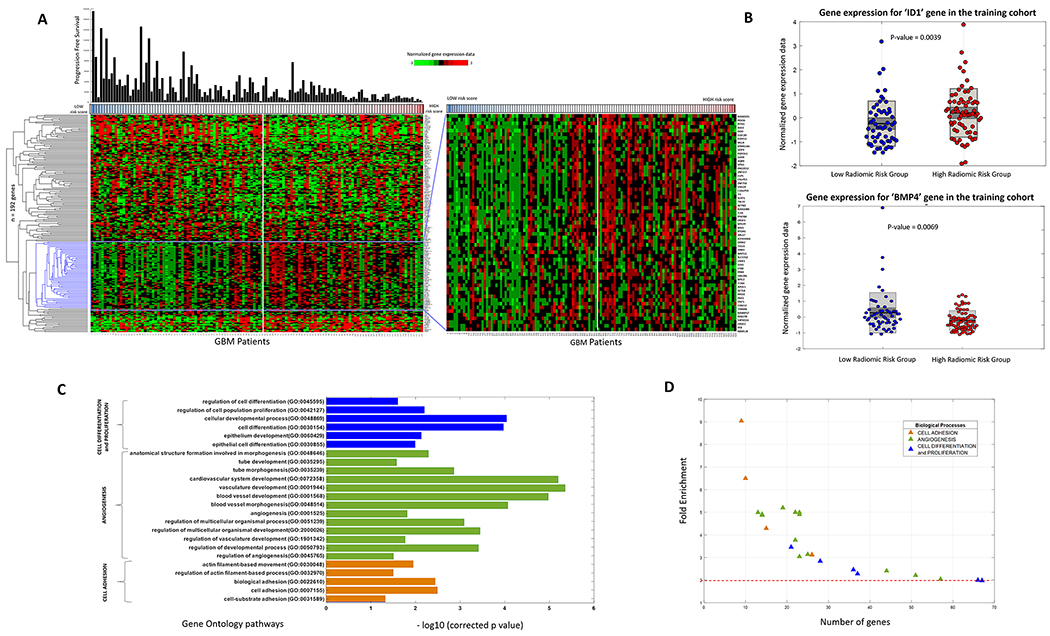
(A) Hierarchical clustering of the differentially expressing genes (n=192, p<0.03, false discovery rate = 3%) for radiomic risk score within the training cohort of 125 GBM patients. The genes were clustered based on the ‘correlation’ distance metric. (B) (left) Box-plot of the ID1 gene expression within the training cohort for the low-risk and high-risk radiomic groups. (right) Box-plot of the BMP4 gene expression within the training cohort for the low-risk and high-risk radiomic groups. High BMP4 expression is known to be associated with better prognosis. In consensus, we report that high BMP4 expression was found in the low radiomic risk group. (C) Gene Ontology analysis revealed several biological processes that were associated with the radiomic risk score. Fisher’s exact text (with Bonferroni correction for multiple testing of 5%), related the radiomic risk score of progression free survival with biological processes of cell differentiation, proliferation, angiogenesis and cell adhesion. (D) 2-D scatter plot to show the number of genes involved in each biological process.

