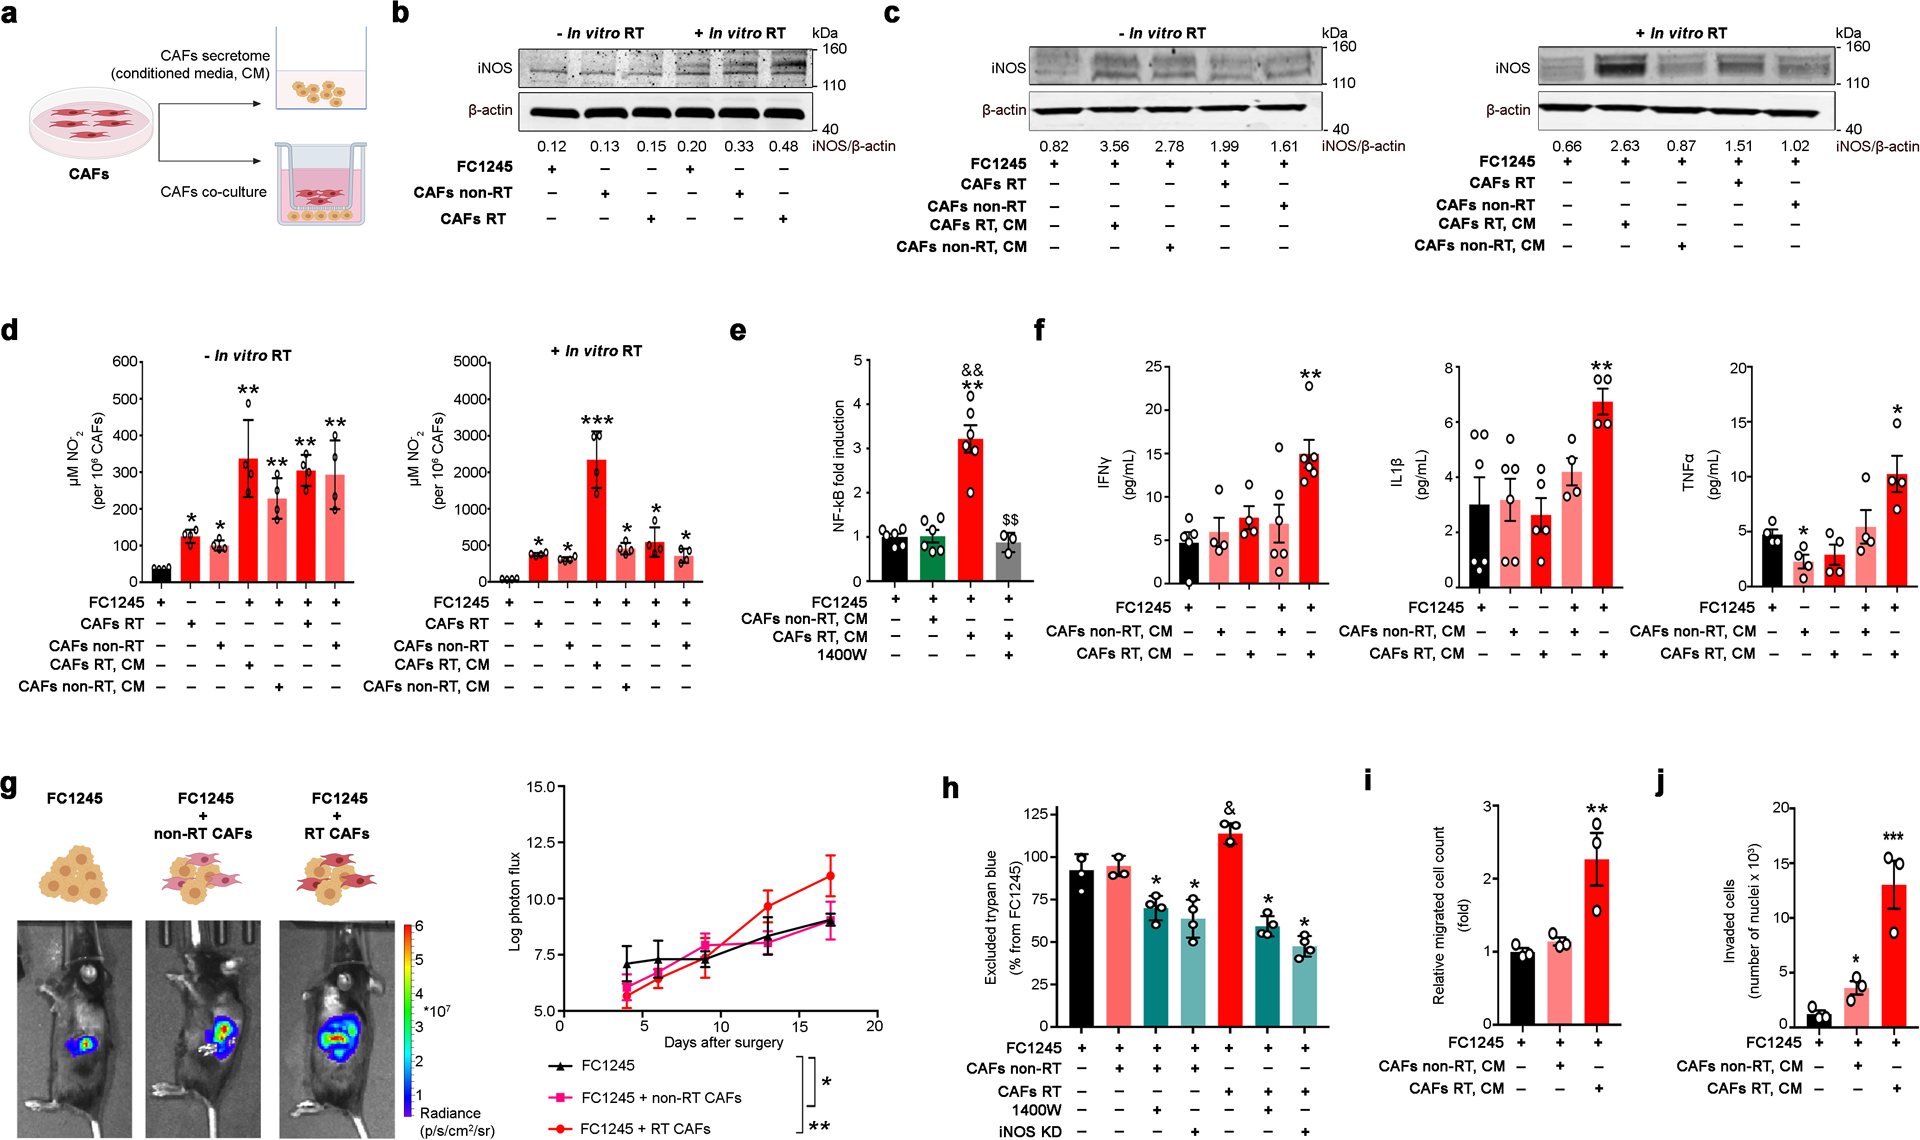
Figure 2. RT-activated CAFs enhance PDAC tumor growth.

a) CAFs were isolated from non-RT treated FC1245 orthotopic PDACs (CAFs non-RT) or from mice treated with a 12 Gy RT dose (CAFs RT). FC1245 were cultured with conditioned medium from CAFs or co-cultured with CAFs using a transwell in vitro system.
b) Western blot of iNOS in total lysates of FC1245, CAFs non-RT, and CAFs RT. Density of western blot bands was quantified by scanning densitometry with ImageJ software.
c) Western blot of iNOS in total lysates of FC1245. FC1245 cells were co-cultured with CAFs (CAFs RT or CAFs non-RT) or treated with conditioned medium from CAFs (CAFs RT, CM or CAFs non-RT, CM) for 24 h. Density of western blot bands was quantified by scanning densitometry with ImageJ software.
d) NO2− levels in supernatants of FC1245, CAFs RT, CAFs non-RT, FC1245 treated with supernatants from CAFs, and FC1245 co-cultured with CAFs. *P<0.05, **P<0.01, ***P<0.001 compared with FC1245 and based on a Student’s t-test (mean ± S.E.M, n = 4).
e) Luciferase NFĸB activity assay (mean ± S.E.M, n = 3) in FC1245 cells cultured with CM non-RT CAFs, CM RT-CAFs, and CM RT-CAFs in the presence of 10 μM 1400W. **P<0.01 compared with FC1245, &&P<0.01 compared with FC1245 treated with CM from non-RT CAFs, $$P<0.01 compared with FC1245 treated with CM from RT-CAFs and based on a Student’s t-test. 1400W N-(3-(aminomethyl)benzyl)acetamidine.
f) IFNγ, IL1β, and TNFα concentrations in the supernatants of FC1245 PDAC cells (first bar on the graph), non-RT CAFs (second bar), RT-CAFs (third bar), FC1245 incubated with CM from non-RT CAFs (fourth bar), and FC1245 incubated with CM from RT CAFs (fifth bar). Cell supernatants were collected at 24 h after cell culture and cytokine activity was determined using the MILLIPLEX MAP Mouse Cytokine/Chemokine Magnetic Bead 32 Plex Panel. Data are presented as mean ± S.E.M., n = 4 to 6 independent experiments. *P<0.05, **P<0.01 compared with FC1245 and based on a Student’s t-test. IFNγ interferon-α, IL1β interleukin 1β, TNFα tumor necrosis factor-α.
g) Bioluminescence images and tumor growth rate (mean ± S.D., n = 4) of pancreatic orthotopic tumors developed by implantation of FC1245luc+ alone, FC1245luc+ mixed with non-RT CAFs, and FC1245luc+ mixed with RT-CAFs into the pancreas of C57BL/6 (B6) mice. *P<0.05, **P<0.01 compared with FC1245.
h) Cell growth of FC1245 cultured in the presence or absence of CM of irradiated and non-irradiated CAFs. To deplete iNOS, FC1245 tumor cells were treated with 10 μM 1400W or transfected with iNOS siRNA (iNOS KD). Data are presented as mean ± S.E.M., n = 3. *P<0.05 compared with FC1245 plus CAFs non-RT or FC1245 plus CAFs RT, &P<0.05 compared with FC1245 and based on a Student’s t-test. 1400W N-(3-(aminomethyl)benzyl)acetamidine.
i,j) FC1245 migration (i) and invasion (j) after treatment with CM of CAFs using the Boyden and Matrigel invasion chambers, respectively. Data are presented as mean ± S.E.M., n = 3. *P<0.05, **P<0.01, ***P<0.001 compared with FC1245 and based on a Student’s t-test.
