
Figure 1. Experimental procedure and data analysis.
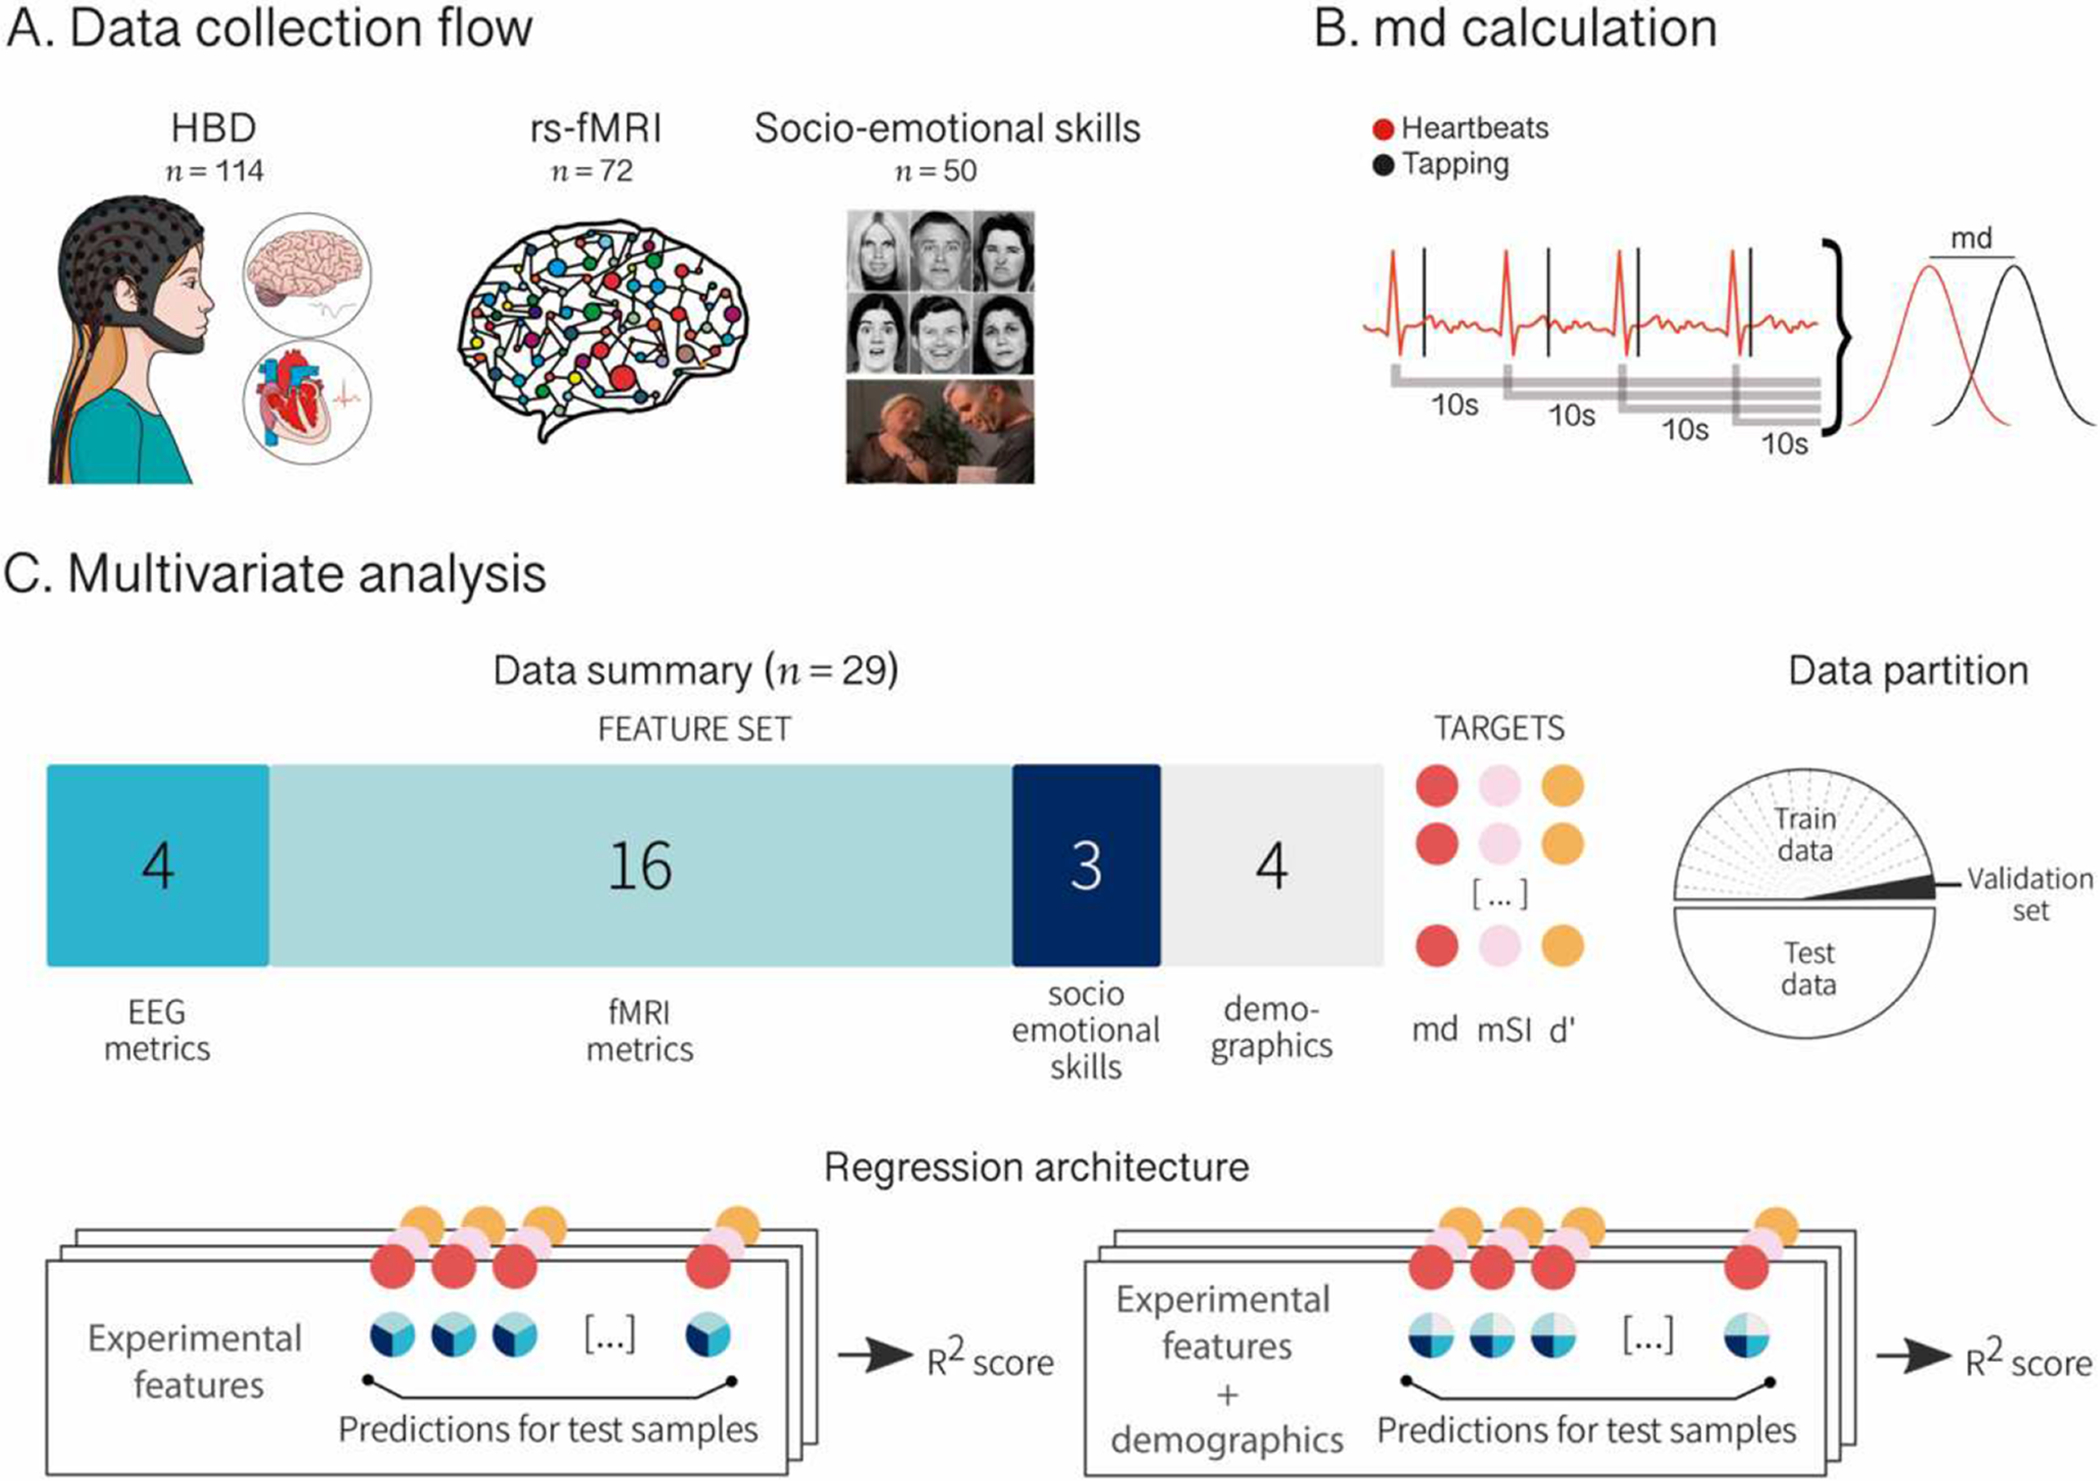
A. Data collection flow. Participants performed a heartbeat detection (HBD) task in which they were instructed to tap a key following their own heartbeats while electrocardiographic (ECG) and high-density electroencephalographic (hd-EEG) signals were recorded. This was done twice (two 2-min blocks). Then, a subsample of participants underwent a resting-state functional magnetic resonance imaging (fMRI) session and a socio-emotional skills assessment involving emotion recognition tasks (Ekman-35 and TASIT-EET). B. md calculation. During the HBD task, tapping responses and ECG signals were recorded and logged as marks in time. To calculate IA-md, blocks were subdivided in overlapping 10-second windows starting at each individual heartbeat. The absolute difference between cardiac frequency and response frequency (md) was computed for each individual window and averaged over all windows comprising both blocks. C. Multivariate analysis. Four heart-evoked potential (HEP) modulation metrics from EEG recordings, 16 functional connectivity metrics from fMRI registers, and three emotion recognition scores from the socio-emotional skills assessment were introduced as selected features in a linear regression model to test their power in predicting IA-md score as well as two other indexes for comparison: a modified version of Schandry’s index (mSI) and a d’ score. The regression was then repeated including four demographic and executive functioning features (‘demographics’). For both analyses, data were split in 50–50 train and test partition and optimized over a validation set bootstrapped from train partition. We assessed the coefficient of determination (R2) between the target and the predicted value for data in test partition.