
Figure 2. Results.
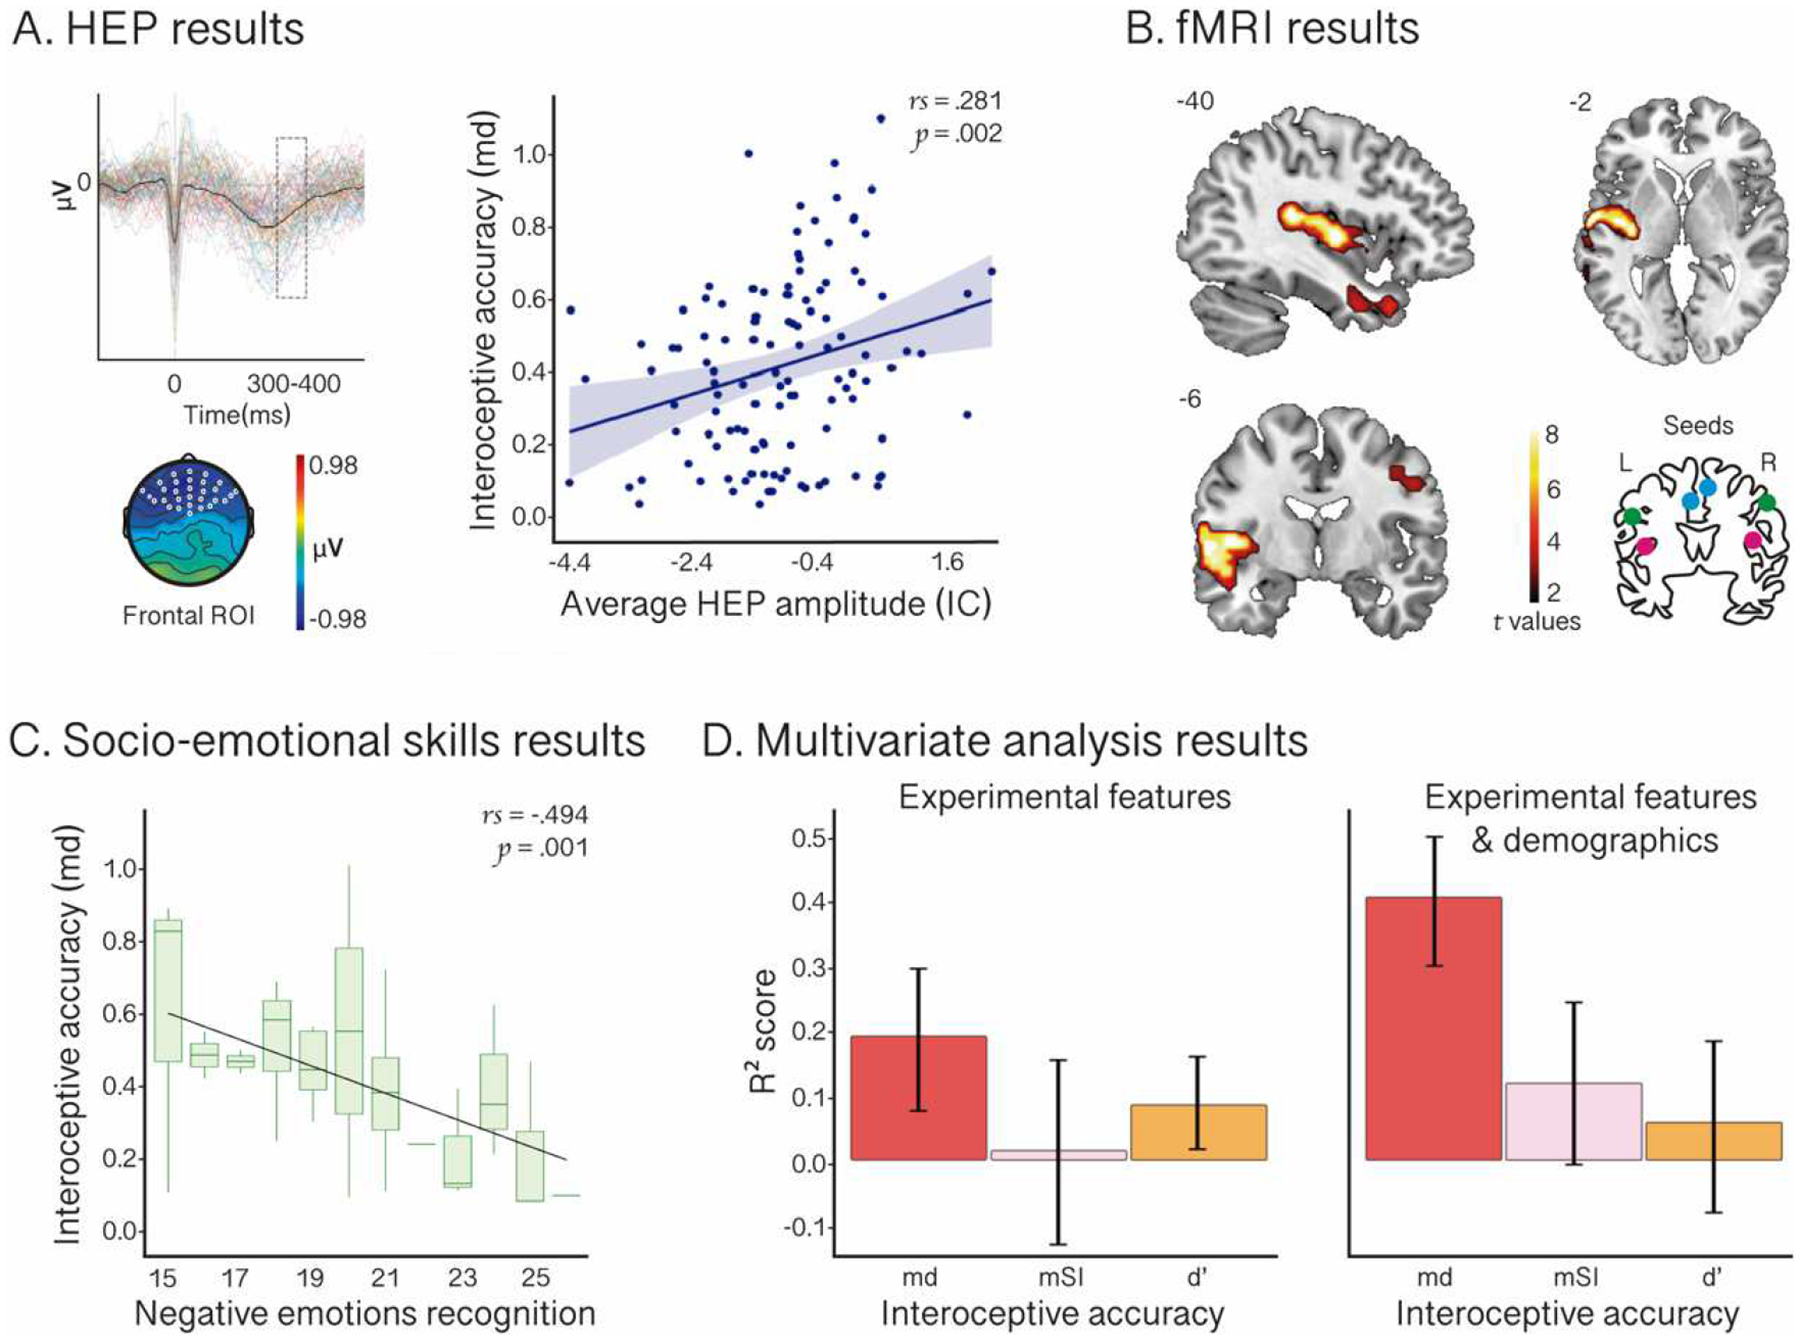
A. HEP results. The HEP diagram illustrates the modulation of this component for each subject. Outliers were excluded for visualization purposes. The scalp topography shows the sample’s average amplitude (microvolts) in the epoch (−300 to 500 ms). The graph on the right displays the correlation between IA-md and the average HEP amplitude during the interoceptive condition of the HBD in a window time-locked to 300–400 ms after the R-wave (shadowed box in the HEP diagram) in an extended frontal-central region of interest (ROI) –white dots in the scalp topography. B. fMRI results. Functional connectivity between insular, frontal, superior-temporal, postcentral, precentral, and inferior parietal cortical regions and interoceptive seeds significantly associated with IA-md. Results for all seeds are plotted together. The brain diagram on the bottom right illustrates the seeds: left and right insula (pink), left and right anterior cingulate cortex (blue), and left and right postcentral cortex (green). L: left; R: right. C. Socio-emotional skills results. Correlation between IA-md and negative emotion recognition, as measured through the sum of the performance in the Ekman-35 and the TASIT-EET global scores. Boxplots indicate the median and range of subjects’ IA-md performance. D. Multivariate analysis results. Combined HEP, fMRI, and socio-emotional skills metrics (i.e., experimental features) yielded a greater coefficient of determination for IA-md than for IA-mSI and IA-d’ (left panel), and these results persisted when adding demographic features, even improving for IA-md (right panel). Regressor performance is shown on test data.