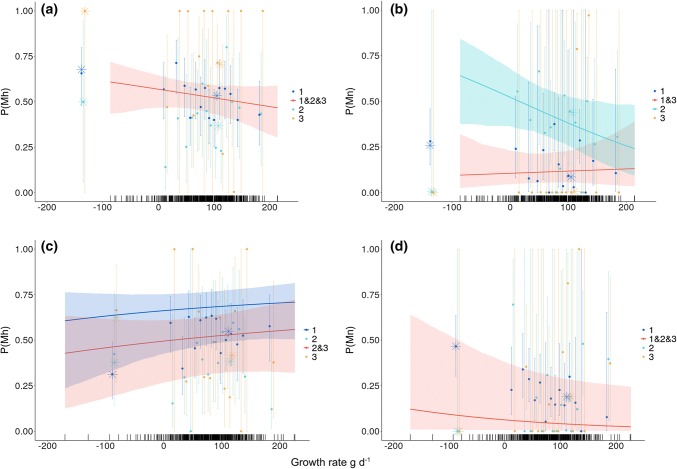
Fig. 4.
Age-specific hunting mortality (a and c; P(Mh)) and non-hunting mortality (b, and d; P(Mn)) as a function of early-life growth rate (in g/day) for (a and b) male and (c and d) female wild boar in Châteauvillain-Arc-en-Barrois. The points depict the mortality estimates and 95% confidence intervals from a model for each class of early-life growth rates included as a categorical variable. The lines correspond to mortality estimates for each age class included in the selected models with early-life growth rate as a continuous variable (see Table 2B) and associated 95% confidence intervals. The rug plot shows the distributions of early-life growth rates for each sex. The stars depict age-specific mortality estimates from models with either negative to zero early-life growth rates or positive early-life growth rates. The estimates from the categorical models are plotted against the median value in the range of early-life growth rates for a given bin

