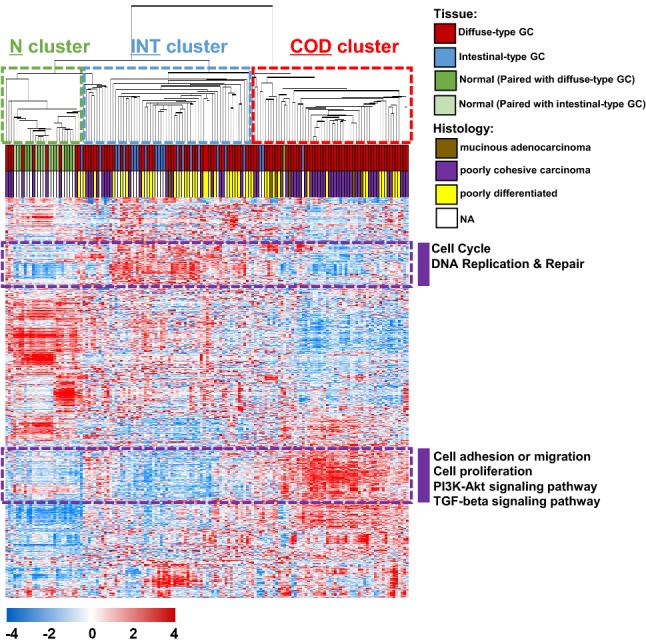
Fig. 1.

Gene expression patterns of the gastric cancer (GC) samples in the original cohort including diffuse-type tumors (n = 150). A total of 3586 genes with showing greater variation in expression changes across the samples were selected for cluster analysis [standard deviation (SD) > 0.9]. The data are presented in matrix format, in which rows represent individual genes, and columns represent each tissue sample. The red and blue colors reflect high and low expression levels, respectively. NA not available
