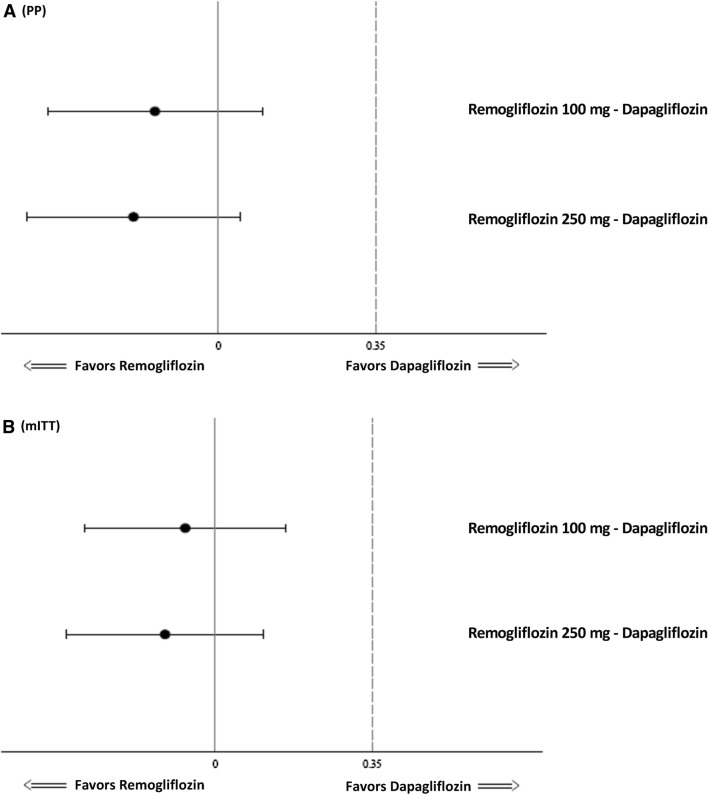
Fig. 3.
Forest plot of treatment difference of mean change in HbA1c (%) levels from baseline at 24 weeks (PP and mITT population). a PP: p values of noninferiority for remogliflozin etabonate 100 mg—dapagliflozin and remogliflozin etabonate 250 mg—dapagliflozin: < 0.001, < 0.001, respectively. b mITT: p values of noninferiority for remogliflozin etabonate 100 mg—dapagliflozin and remogliflozin etabonate 250 mg—dapagliflozin: 0.001, < 0.001, respectively. HbA1c glycated hemoglobin, mITT modified intent-to-treat, PP per protocol

