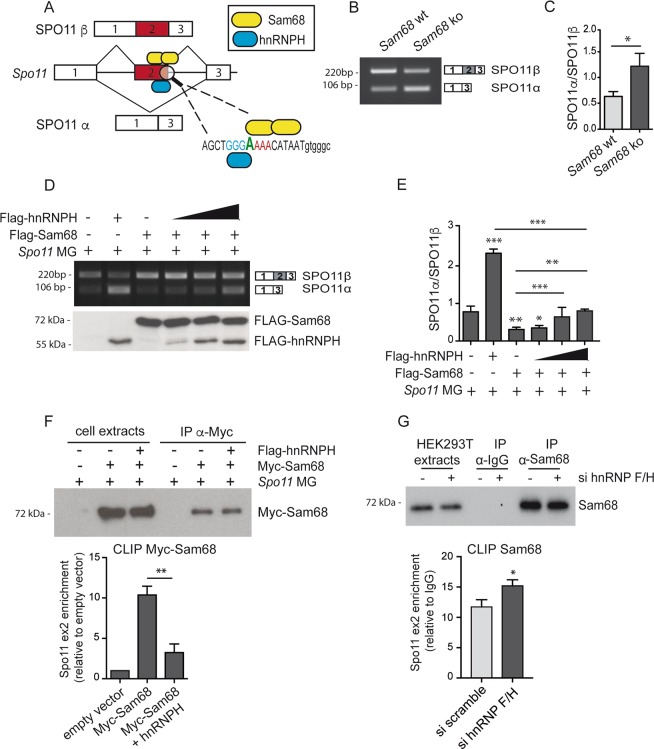
Fig. 6. hnRNPH competes with Sam68 in the binding of exon 2 of Spo11 pre-mRNA.
a Schematic representation of the possible competition between hnRNPH and dimeric Sam68 for the binding to Spo11 exon 2 near the 5′ splice site. b Representative RT-PCR analysis of endogenous Spo11 mRNA in germ cells extracted from wild-type (wt) or Sam68 knockout (ko) testes. c Bar graph represents the densitometric analysis of the SPO11α/SPO11β ratio in germ cells extracted from wild-type (wt) or Sam68 knockout (ko) testes (mean ± SD; n = 4; *P ≤ 0.05, unpaired t test). d RT-PCR analysis of Spo11 minigene splicing assay performed in HEK293T cells transfected with or without Flag-Sam68 or increasing amounts of Flag-hnRNPH. Relative expression of Sam68 and hnRNPH was detected by Western blot using the anti-FLAG antibody. e Bar graph represents densitometric analysis of the SPO11α/SPO11β ratio of Spo11 minigene splicing assay performed in HEK293T cells transfected with or without Flag-Sam68 or increasing amounts of Flag-hnRNPH (mean ± SD; n = 3, *P ≤ 0.05, **P ≤ 0.01, ***P ≤ 0.001, unpaired t test). f CLIP assays of MYC-Sam68 binding to the Spo11 pre-mRNA. HEK293T cells were transfected with the Spo11 minigene and Myc-Sam68 or Flag-hnRNPH. Immunoprecipitation of Myc-Sam68 was analyzed by Western blot with anti-MYC antibody. The bar graph shows qPCR signals of Spo11 exon 2 amplified from the CLIP assays expressed as enrichment in the anti-MYC-Sam68 immunoprecipitates in Myc-Sam68 expressing cells relative to cells expressing the MYC empty vector (mean ± SD; n = 3; **p ≤ 0.01, unpaired t test). g CLIP assay of endogenous Sam68 binding to the Spo11 minigene in HEK293T cells transfected with scramble and hnRNPF/H siRNAs. Silencing efficiency was assessed by Western blot analysis (Supplementary Fig. S5). Cells were immunoprecipitated with control IgGs or anti-Sam68 antibody. The Western blot shows specific immunoprecipitation of Sam68. The bar graph shows qPCR signals amplified from the CLIP assays expressed as Spo11 exon 2 enrichment in the anti-Sam68 immunoprecipitates relative to control IgGs (mean ± SD; n = 3; *P ≤ 0.05, unpaired t test). The blots shown are representative of three images captured (d, f, g).

