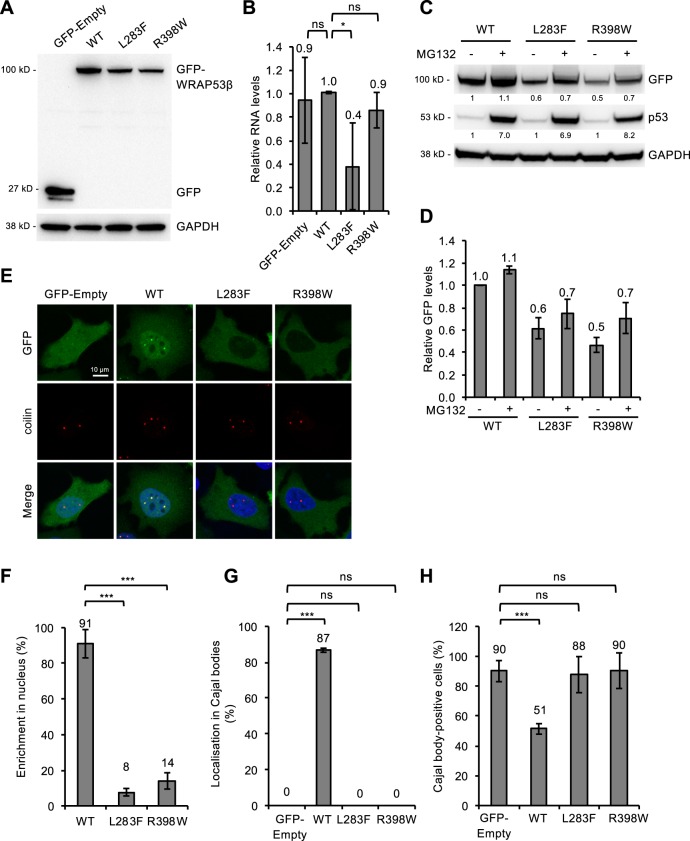
Fig. 2. WRAP53β mutants associated with HHS are expressed at reduced levels and with an altered localization, disrupting the structure of Cajal bodies.
a HeLa cells were transfected with a vector encoding: EGFP only (GFP-Empty), or EGFP-tagged wild-type (WT) or mutant (L283F or R398W) WRAP53β for 24 h and thereafter subjected to western blot for GFP and GAPDH. b Quantitative PCR analysis of the levels of mRNA encoding EGFP alone (GFP-Empty), EGFP-tagged wild-type (WT) or mutant (L283F or R398W) WRAP53β in HeLa cells 24 h post-transfection. Primers targeting the GFP sequence were utilized to avoid detection of endogenous WRAP53β. The values shown represent the RNA levels normalized to β-actin and relative to the levels of GFP-WT WRAP53β. c HeLa cells were transfected with a vector encoding: EGFP-tagged wild-type (WT) or mutant (L283F or R398W) WRAP53β for 16 h followed by addition of the protease inhibitor MG132 (10 μM) for another 8 h, as indicated. GFP, p53, and GAPDH were detected by western blot. The levels of p53, a protein with rapid turnover via the proteasome, was used as a control for proteasome inhibition by MG132. The numbers in black represent densitometric quantification of each protein normalized to GAPDH and relative to the levels of wild-type WRAP53β (for the GFP proteins) or p53 (for the p53 protein) in cells not treated with MG132 (first lane). d The same densitometric numbers as shown in c, including error bars. Again, the values represent the GFP levels relative to the levels of wild-type WRAP53β. e Immunofluorescent detection of the GFP-tagged WRAP53β proteins indicated in HeLa cells 24 h post-transfection. The Cajal bodies were visualized by immunostaining for coilin and nuclei stained blue with DAPI in all cases. f Quantification of cells as shown in e exhibiting nuclear enrichment of the GFP-tagged wild-type or mutant WRAP53β. The bars indicate the percentage of 100 GFP-positive cells in each experiment in which the nuclear signal was at least as intense as the signal in the cytoplasm (i.e., with a nuclear/cytoplasmic signal intensity ratio ≥1). g Quantification of cells as shown in e in which GFP accumulated in Cajal bodies. The bars indicate the percentage of 100 cells in each experiment that stained for both GFP and Cajal bodies and in which these bodies were enriched for GFP. h Quantification of cells as shown in e containing Cajal bodies. The bars indicate the percentage of 100 GFP-positive cells whose nuclei also contained Cajal bodies (i.e., formation of coilin foci). In all cases, the values are means ± s.d. (the error bars) (n = 3). *p < 0.05, **p < 0.01, ***p < 0.001, ns (not significant) as determined by Student’s t-test.

