Figure 2.
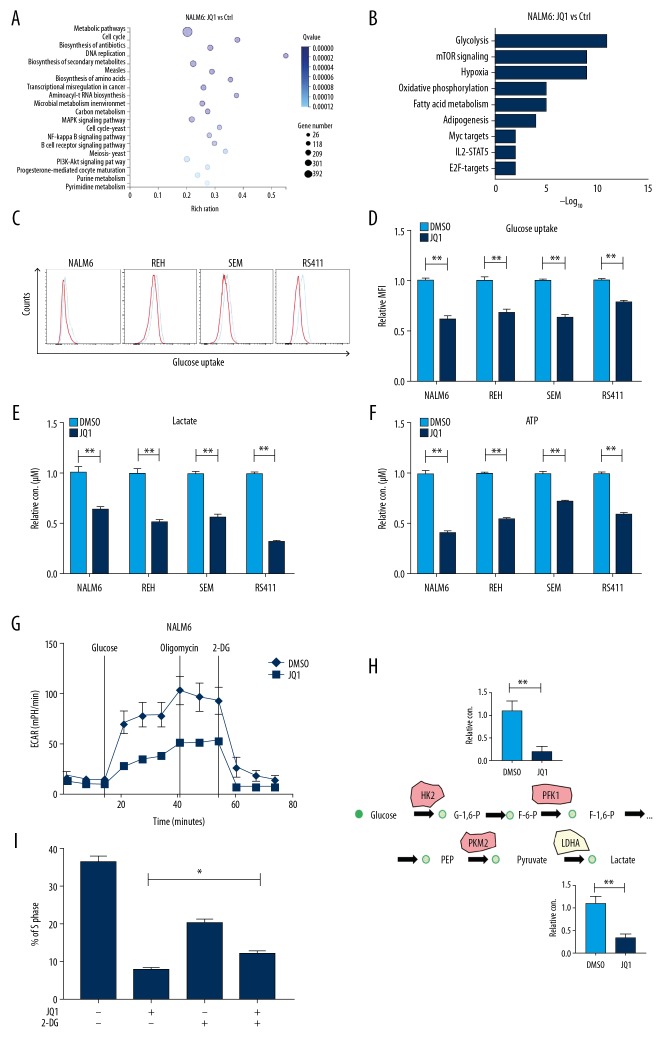
JQ1 suppressed the growth of B-ALL cell lines by inhibiting glycolysis. (A) Bubble diagram of enrichment analysis in NALM6 cells measured by RNA-seq after treatment with DMSO or JQ1 (1 μM) for 48 h. (B) Pathway analysis of downregulated metabolic genes (False Discovery Rate <0.05) in JQ1-treated NALM6 cells. (C) Glucose uptake of NALM6, REH, SEM, and RS411 cells detected by flow cytometry after treatment with DMSO or JQ1 (1 μM) for 48 h. (D) Statistical analysis of NALM6, REH, SEM, and RS411 cells estimated using the related kits after DMSO or JQ1 (1 μM) treatment for 48 h. (E) Quantification of lactate production in NALM6, REH, SEM, and RS411 cells assessed using the related kit after treatment with DMSO or JQ1 (1 μM) for 48 h. (F) Quantification of intracellular ATP in NALM6, REH, SEM, and RS411 cells assessed using the related kits after treatment with DMSO or JQ1 (1 μM) for 48 h. (G) Detection of ECAR in NALM6 cell after treatment with DMSO or JQ1 (1 μM) for 48 h by seahorse. (H) Schematic map of glycolytic metabolism and the metabolic intermediates of glycolysis measured by LC-MS/MS. (I) The cell cycle of JQ1 (2 uM)-treated NALM6 cells analyzed by flow cytometry after pretreatment with 2DG (5mM) for 12 h. * P<0.05; ** P<0.01.

