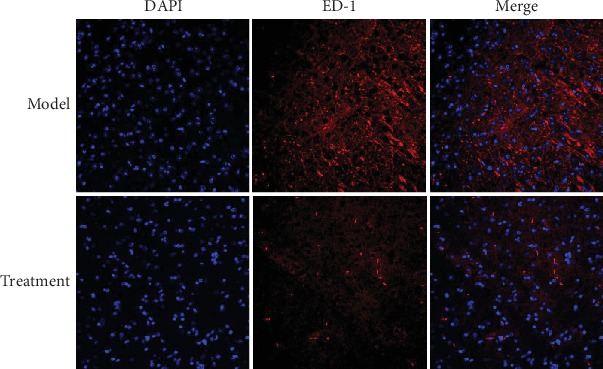
Figure 6.

ED1 fluorescence expression in the spinal cord tissue of each group. Frozen sections of the spinal cord tissue were stained with primary anti-rabbit source ED1 (1 : 200) and secondary antibody Cy3-labeled goat anti-rabbit IgG (H+L) (1 : 500); the nucleus was stained with DAPI, and ED1 fluorescence in the spinal cord tissue was higher in the model group than in the treatment group. Scale bars: 50 μm.
