
Figure 11.
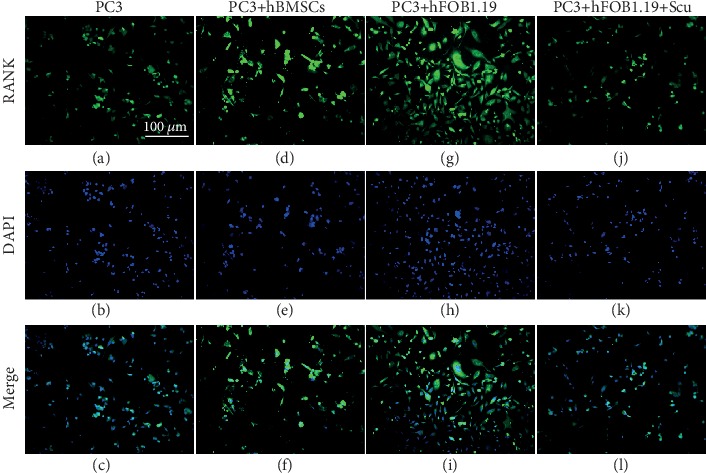
Immunofluorescence analysis of RANKL expression in PC3 cells. The numbers and fluorescence intensity of cells in the PC3 (control), PC3+hBMSC, PC3+hFOB1.19, and PC3+hFOB1.19+Scu groups are shown.
Official websites use .gov
A
.gov website belongs to an official
government organization in the United States.
Secure .gov websites use HTTPS
A lock (
) or https:// means you've safely
connected to the .gov website. Share sensitive
information only on official, secure websites.
Immunofluorescence analysis of RANKL expression in PC3 cells. The numbers and fluorescence intensity of cells in the PC3 (control), PC3+hBMSC, PC3+hFOB1.19, and PC3+hFOB1.19+Scu groups are shown.