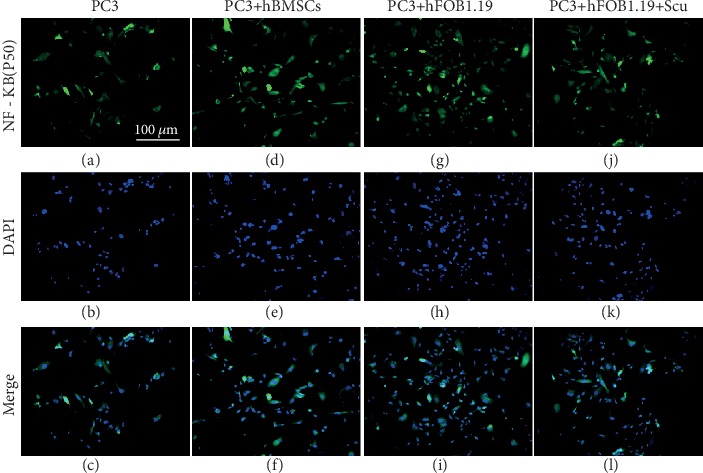
Figure 12.

Immunofluorescence analysis of NF-κB (p50) expression in PC3 cells. The numbers and fluorescence intensity of cells in the PC3 (control), PC3+hBMSC, PC3+hFOB1.19, and PC3+hFOB1.19+Scu groups are shown. Nuclear translocation of NF-κB (p50) was also observed.
