Figure 1.

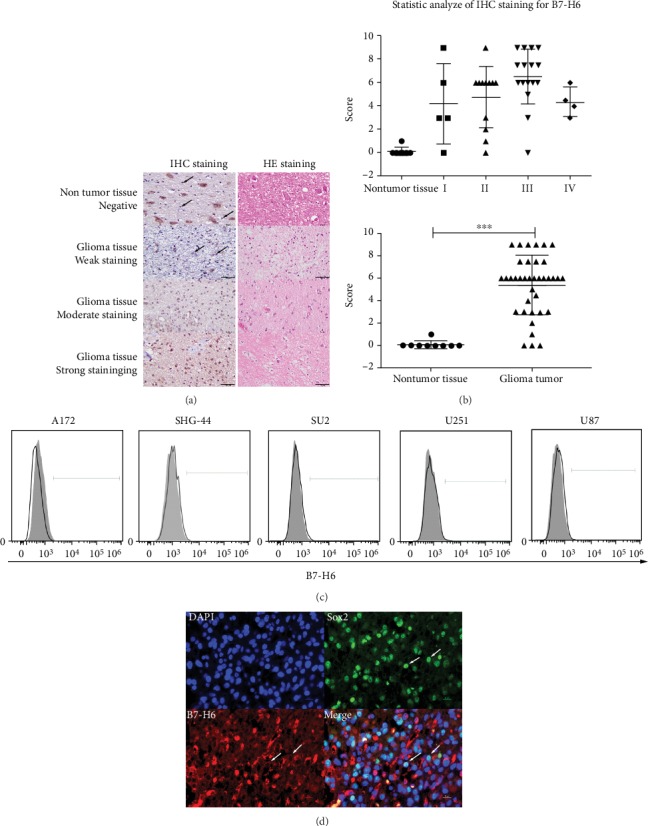
B7-H6 expression in glioma samples and cell lines. (a) IHC staining (left column) of B7-H6 together with HE staining (right column) was performed on paraffin section (400x). Results were listed as negative or weakly positive, moderate positive, and strong positive expression. (b) Statistic analysis of IHC staining for B7-H6 in glioma samples. Left figure was organized by WHO grade while right figure was separated with nontumor tissues and glioma tissues. (c) B7-H6 expression was detected in glioma cell lines by flow cytometry. Filled histograms represent to isotype controls while open histograms represent to staining groups. (d) B7-H6 and Sox2 were costained on sections and coexpressed on certain cell (400x). Data of (b) were shown as mean ± SD. ∗P < 0.05 and ∗∗∗P < 0.005.
