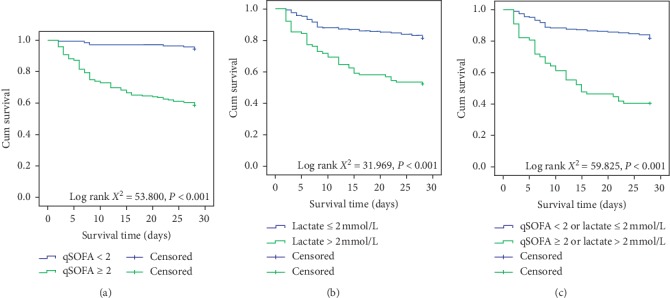
Figure 6.

Kaplan–Meier survival curve comparison: (a) between septic CAP patients with admission qSOFA < 2 and septic CAP patients with admission qSOFA ≥ 2; (b) between septic CAP patients with admission lactate ≤ 2 mmol/L and septic CAP patients with admission lactate > 2 mmol/L; (c) between septic CAP patients with admission qSOFA < 2 or lactate ≤ 2 mmol/L and septic CAP patients with admission qSOFA ≥ 2 or lactate > 2 mmol/L.
