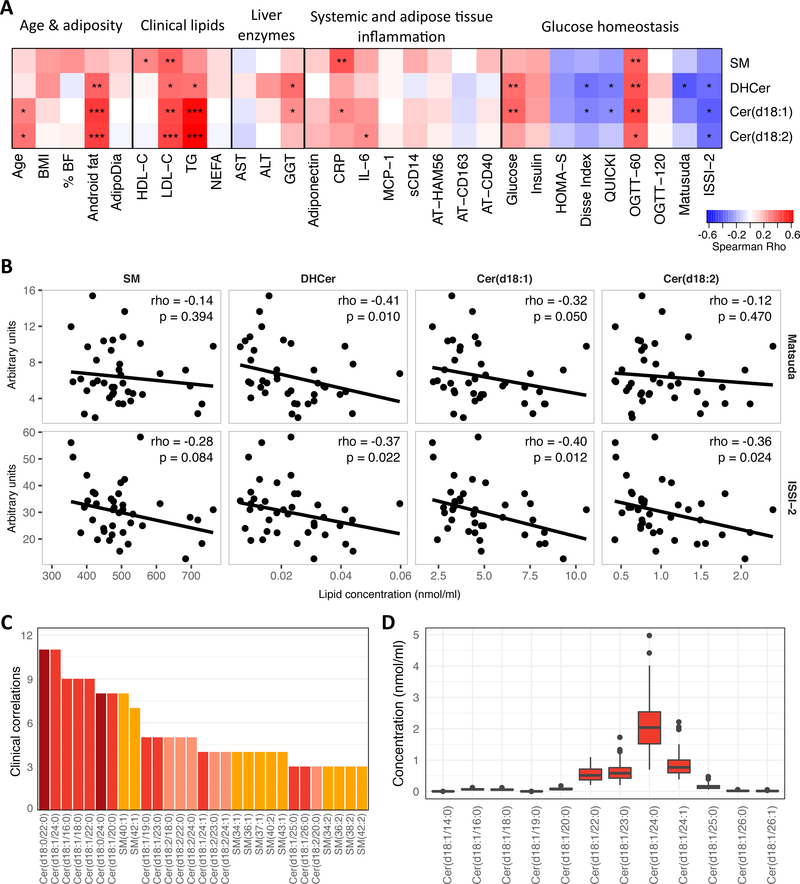
Figure 1.
A: Spearman correlations between clinical variables and sphingolipid subclasses. *P<0.05, **P<0.01, ***P<0.001. % BF = Percent body fat, AdipoDia = adipocyte diameter, TG = fasting triglycerides, NEFA = non-esterified free fatty acids, sCD14 = soluble CD14, OGTT-60 and OGTT-120 = plasma glucose during OGTT at 60 and 120 minutes, respectively, ISSI-2 = insulin-secretion-sensitivity-index-2. B: Lipid subclasses vs. OGTT-derived Matsuda index (top) and ISSI-2 (bottom). Rho and p-values from spearman correlations. Regression line is a robust regression fit with the R function ‘rlm’. C: Sum of significant associations (P<0.05) for spearman correlation of each lipid species to each non-lipid (e.g. HDL-C) clinical parameter. See Online Resource 3w for complete results. Lipid species are colored by subclass. DHCer are labeled by their chemical structure Cer(d18:0). D: Absolute serum concentration of individual Cer(d18:1) species.

