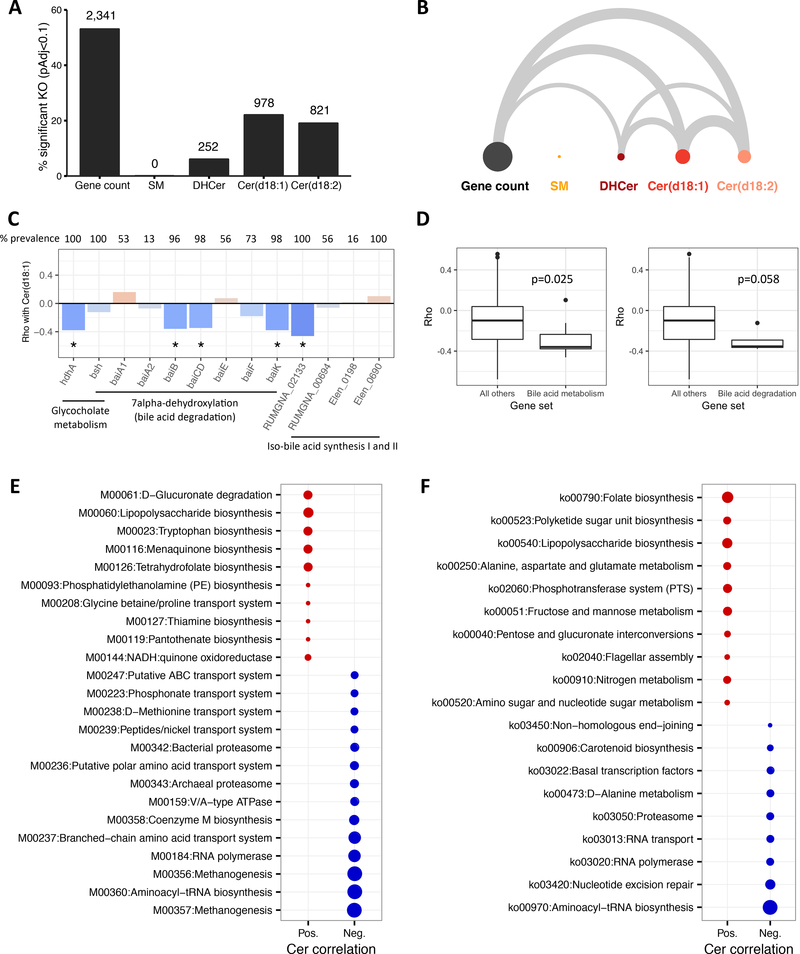
Figure 4.
A: Percentage of total KOs significantly correlated (Padj<0.1) with gene count and lipid subclasses (number of significant KOs is above bars). B: Arc diagram where width of edge is proportional to the significant KOs shared between gene count and lipid subclasses. C. Spearman correlations between bile acid metabolism genes and Cer(d18:1), prevalence is percent of participants with abundance greater than 0, *Padj<0.1. D: Comparison of correlations between all bile acid metabolism genes (left) or bile acid degradation genes (right) and all KOs not in the respective gene sets, p-values are from the reporter features algorithm. E: Reporter modules positively (red) or negatively (blue) correlated to Cer(d18:1) (Padj<0.05). Circle size is proportional to statistical significance. F: Reporter pathways for Cer(d18:1) (Padj<0.05).

