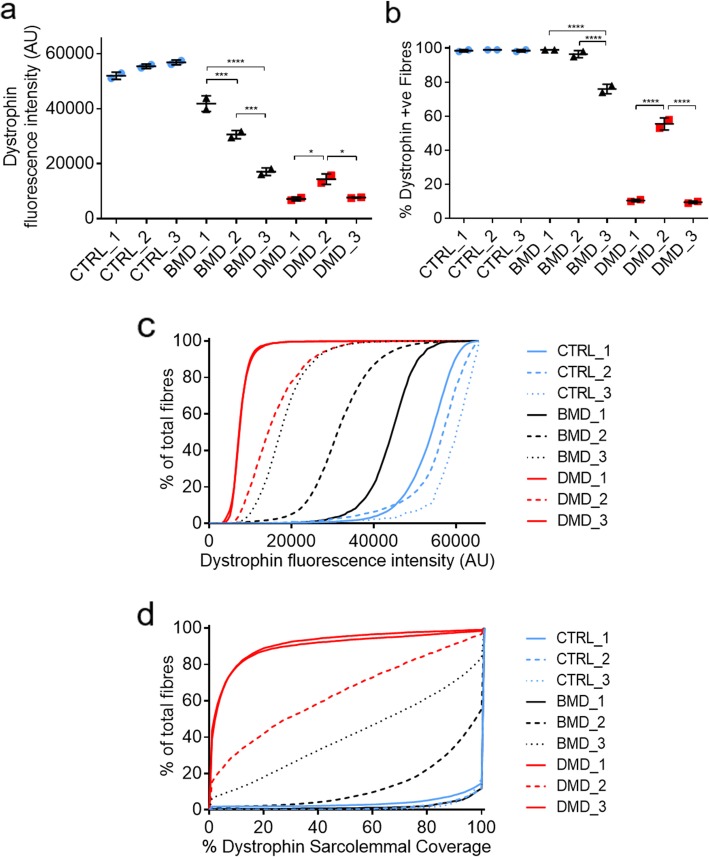
Fig. 2.
a Mean sarcolemmal dystrophin intensity based on sarcolemmal fluorescence analysis of dystrophin immunostaining. b % myofibres positive for dystrophin immunostaining. A positive fibre is classified as having > 25% sarcolemmal circumference coverage for dystrophin immunostaining. c Cumulative frequency graph for sarcolemmal dystrophin fluorescence intensity and d cumulative frequency graph for % of positive sarcolemmal dystrophin circumference coverage in all samples. All samples were immunostained and acquired at the same time under the same conditions. N = 2 serial sections for each sample

