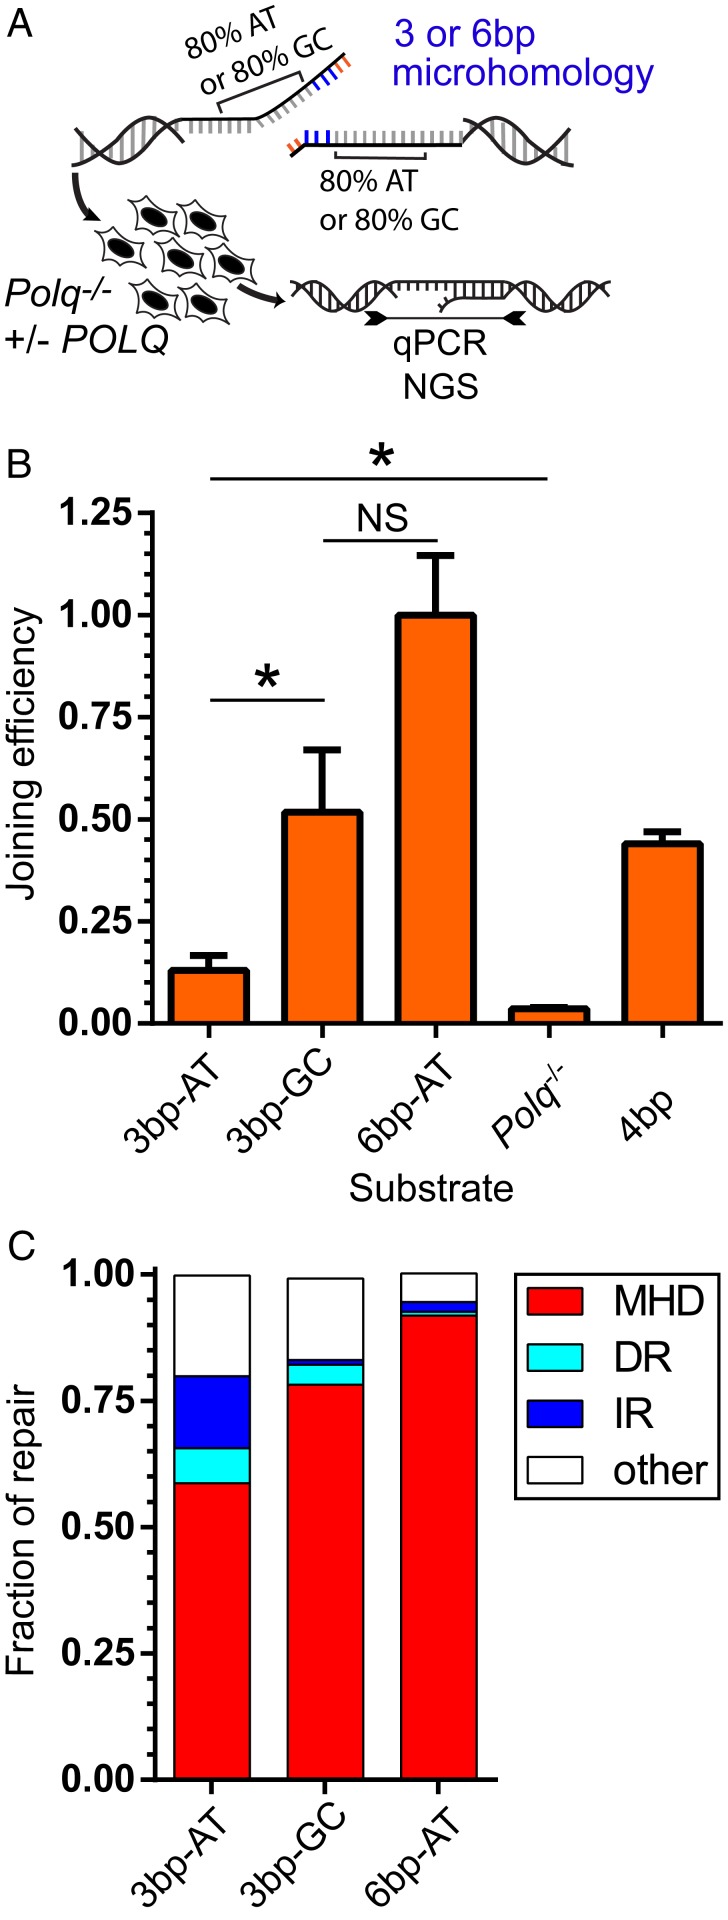
Fig. 5.
Frequency of TINS is dependent on both microhomology size and template AT content. (A) TMEJ substrates possessed the same 3-bp microhomology followed by 20 bp of template that was either 80% AT (3 bp-AT) or 80% GC (3 bp-GC), or which possessed the 80% AT content template, but a longer 6-bp microhomology (6 bp-AT). The efficiency of cellular TMEJ (B) was determined for each substrate as in Fig. 2A, and product structures (C) were characterized by NGS. (B) Joining efficiency was determined by qPCR and normalized to results using the 6 bp-AT substrate and compared to results using the original 2/2 4-bp (4 bp) substrate described in Fig. 2A. Bars represent the mean and error bars the SEM from three biological replicates. Statistical significance was assessed by one-way ANOVA with Bonferroni correction to account for multiple comparisons; NS, not significant; *P < 0.05. (C) TMEJ products were amplified and characterized by sequencing as MHD if possessing deletions at 2 bp or more of microhomology, DR, if products contain 5 bp or more of templated (directly repeated) synthesis or 5 bp or more of templated (inversely repeated, IR) synthesis. “Other” represents products inconsistent with MHD or TINS.

