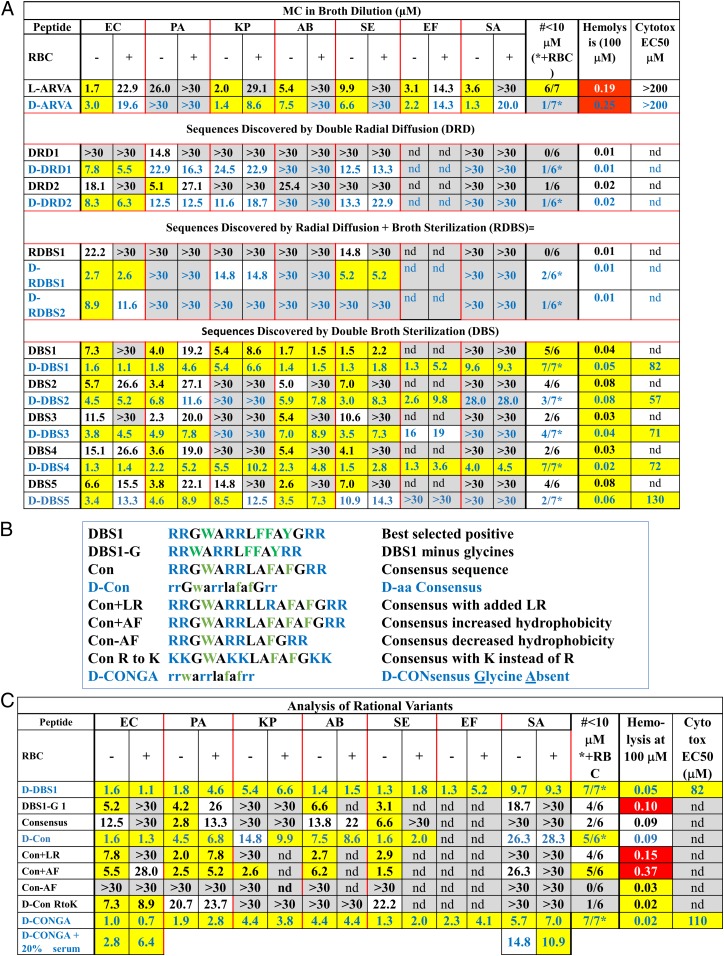
Fig. 2.
Assessment of antibacterial activity and toxicity of selected peptides. (A) MIC values are reported in micromolar peptide against a panel of ESKAPE bacterial pathogens: E. coli (EC), P. aeruginosa (PA), K. pneumoniae (KP), A. baumannii (AB), S. enterica (SE), E. faecium (EF), and S. aureus (SA). The two columns under each organism are for assays performed in the absence (−) and presence (+) of 1 × 10⁹ human RBC/mL yellow: MIC ≤ 10 μM; gray: MIC ≥ 25 μM. “>30” means that sterilization was not observed at 30 μM, the highest concentration tested. Values in blue text are for D-amino acid peptides. The column marked “#≤10 μM” is a count of the number of organisms, out of seven, with MIC ≤ 10 μM. Counts are in the absence of RBC for l-amino acid peptides and in the presence of RBCs for D-amino acid peptides. The column marked “hemolysis” is the fractional hemolysis of 1 × 10⁸ human RBC/mL at 100 μM peptide. Yellow indicates ≤5% hemolysis. The column marked “Cytotox EC50” contains the concentration of peptide that kills 50% of WI-38 human fibroblast cells assayed by entry of SYTOX Green DNA binding dye. Yellow signifies EC50 ≥ 50 μM. SDs of MIC are typically about 50% of the MIC value. SDs in hemolysis are ±0.02 and SDs in cytotoxicity EC50 are ±8 μM. nd, not determined. (B) Rational variants of DBS peptides that were tested and the rationale for each variant. (C) MIC values for rational variants tested, compared to D-DBS1. Definitions and color codes are identical to those in A.

