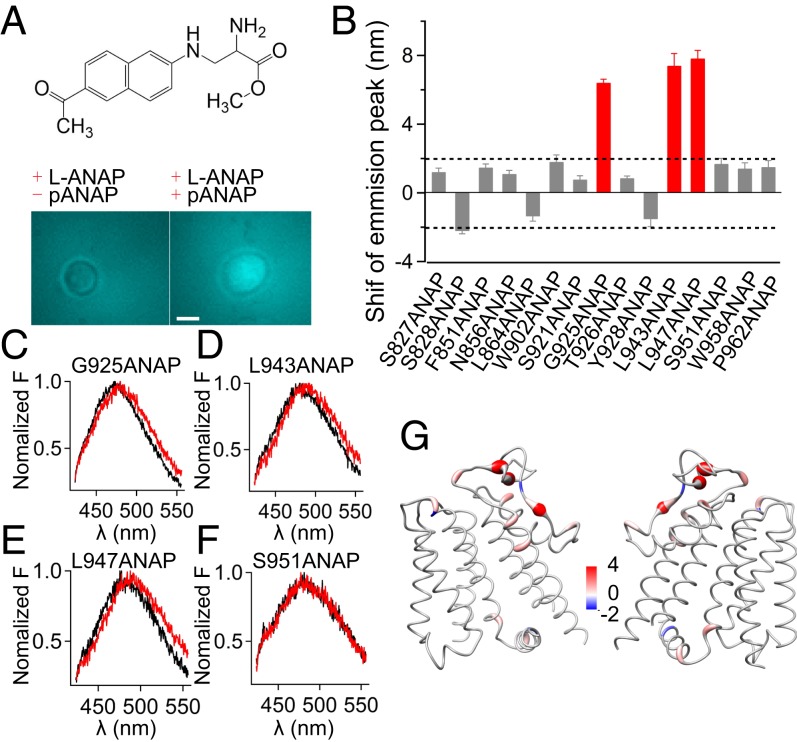
Fig. 3.
Conformational state of key residues in the PD during TRPM8 cold activation. (A, Top) Chemical structure of ANAP. (A, Bottom) ANAP-incorporated TRPM8_LA channels were only expressed in HEK293 cells in the presence of the suppression plasmid (pANAP). Pseudocolors for ANAP are used. (Scale bar, 10 μm.) (B) Summary of the shifts in emission spectra of ANAP incorporated in TRPM8_LA (mean ± SEM; n = 5). The red bars indicate the ANAP emission spectra with significant changes during cold activation. (C–F) Representative ANAP emission spectra measured at low (6 °C) (red) and high temperature (30 °C) (black) for sites 925, 943, 947, and 951, respectively. (G) Shifts in the ANAP emission peak mapped onto the TRPM8_LA model with a worm representation, where the worm radius was proportional to the amplitude of shifts. Right and left shifts are colored in red and blue, respectively. (Scale bar, 6 nm.)

