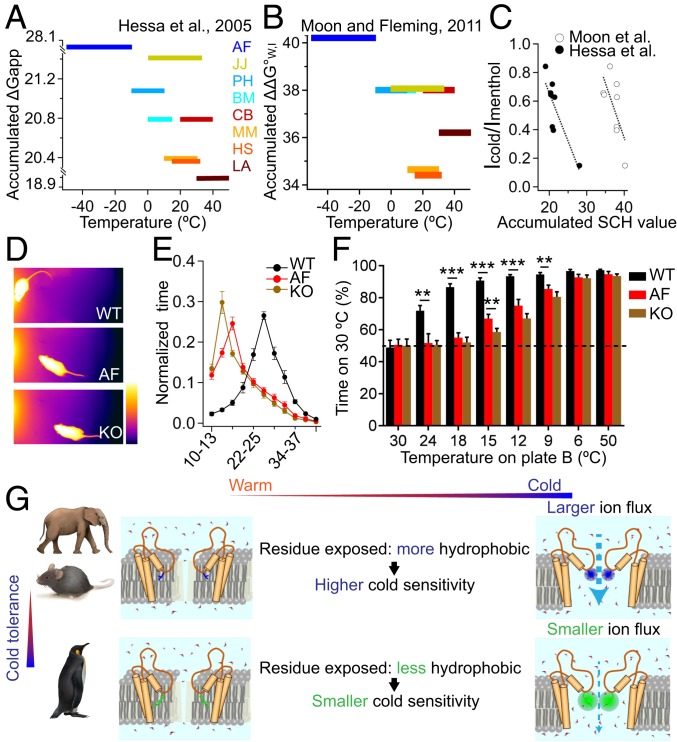
Fig. 5.
Tuning of SCH serves as the adaptation strategy for habitat temperature. (A and B) The relationship between the accumulated SCH value of each TRPM8 ortholog’s PD and the habitat temperature of each vertebrate. SCH values were taken from ref. 24 (A) or ref. 25 (B). (C) The relationship between the accumulated SCH value and the normalized cold response. (D) Images of mice at the comfortable position, indicating the favored temperature. KO, knockout. (Scale bar, 4 to 37 °C.) (E) The detention time of mice at each temperature area was normalized to the total time of the temperature-preference test. Average values represent mean ± SEM (n = 10). (F) Mice were allowed to move freely in a two-temperature choice test with control plate (30 °C) and test plate (ranging from 6 to 30 °C). The percentage of time spent at the control plate was measured every 3 min (mean ± SEM; *P < 0.05, **P < 0.01, ***P < 0.001; n = 10). (G) A cartoon illustrating the molecular mechanism of TRPM8 cold-induced activation and thermal adaptation in vertebrates.

