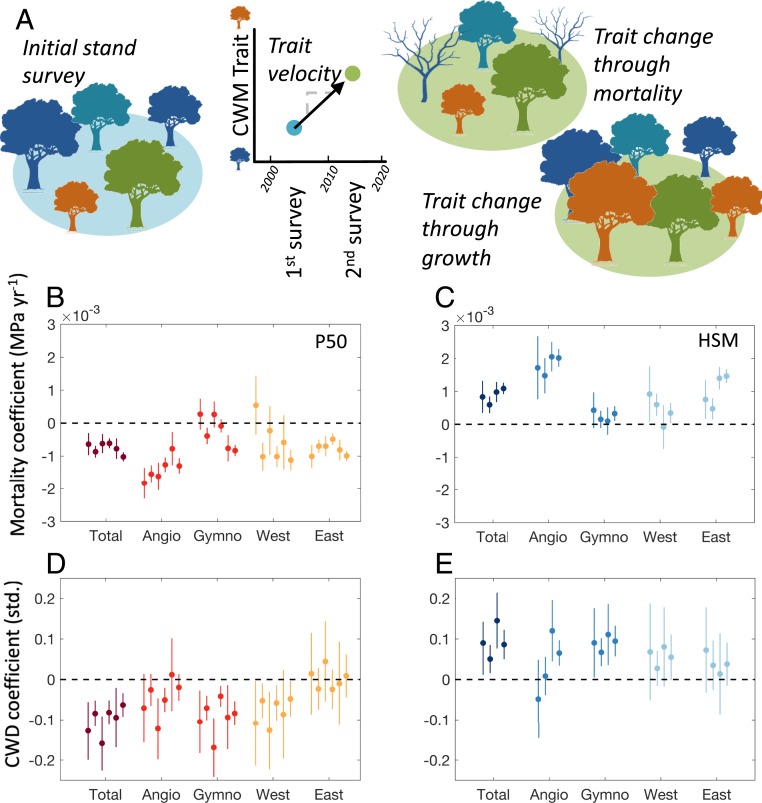
Fig. 3.
Shifts in community trait composition toward more drought-resistant forests are associated with mortality and aridity but differ substantially depending on region and forest type. (Top) Schematic of the mechanisms resulting in shifts in community weighted mean (CWM) trait composition and the subsequent trait velocities including trait change through selective recruitment and growth or through selective mortality of trees with particular traits (A). Different colors represent different species with distinct trait values. (Middle) Response coefficient between forest basal area mortality and community-weighted changes (final minus initial inventory divided by inventory interval length) in key drought tolerance traits including (B) water potential at which 50% of stem xylem conductivity is lost (P50) and (C) HSM for the inventory as a whole (Total), angiosperm forest types (Angio), gymnosperm forest types (Gymno), the eastern United States (East), and the western United States (West). (Bottom) Standardized response coefficients between climatic water deficit (CWD) and community-weighted changes (final inventory minus initial inventory) in (D) P50 and (E) HSM. CWD is calculated for mean growing season (May–August) for the inventory interval. For B–E, grouped points are response coefficient estimates using different data gap filling and outlier screening methods (see Methods). Similar forest types are grouped by color, error bars show 95% confidence intervals, and associated significance levels are in SI Appendix, Tables S2 and S3.

