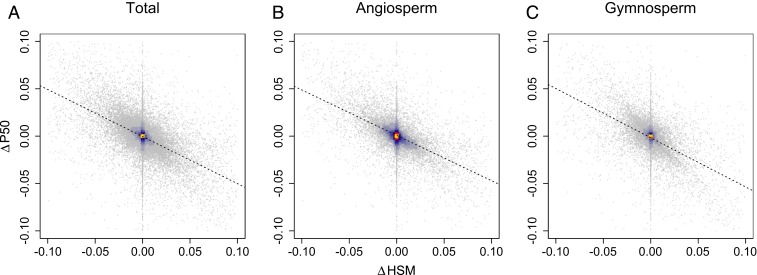
Fig. 4.
Trait velocities between HSM and water potential at which 50% of stem xylem conductivity is lost (P50) are coordinated. Shifts in P50 and HSM (MPa y−1) for (A) the inventory as a whole, (B) angiosperm forest types, and (C) gymnosperm forest types. Each point represents an individual plot with at least 80% trait coverage by basal area in the initial inventory, and hotter colors indicate a higher density of points. Dashed black lines show the ordinary least-squares regression line of best fit. Spearman’s ρ and associated significance levels are in SI Appendix, Table S4.

